Keywords
Special Educational Needs, Target Trial Emulation, Confounding, cerebral palsy, Propensity Score, Inverse Probability Weighting , g-computation
Special Educational Needs, Target Trial Emulation, Confounding, cerebral palsy, Propensity Score, Inverse Probability Weighting , g-computation
Cerebral Palsy is a lifelong condition affecting movement, coordination, muscle control and speech, leading to functional limitations in mobility or communication and quality of life. Cerebral Palsy was identified in 2.5 – 3.4 children per 1000 in England between 2004 and 2014, and disproportionately affects males at twice the rate compared to females1, more deprived infants (in normal birthweight categories) and low-birthweight infants2. Administrative data studies have shown that, despite only accounting for 0.3% of the Northern Irish population aged between 0–24 years, cerebral palsy patients account for 1.6% of hospital admissions and outpatient appointments, with respiratory conditions being the most common cause for emergency hospital care3. On average, children with cerebral palsy have lower school attainment than their peers, attributed mainly to intellectual disability, communication difficulties, and low participation4. National survey data found that children with long term physical conditions (including cerebral palsy) in Great Britain were absent more frequently from school than children without long-term physical conditions (adjusted incident rate ratio 1.47, 95% Confidence Interval: 1.31 – 1.64), usually due to health complications5.
These functional limitations lead to learning difficulties and worse educational outcomes, meaning that children with cerebral palsy are eligible for additional support in school6. In England, additional provision for special Education Needs (SEN) includes adaptations to meet children’s needs with the goal of enabling fair access to education. Examples of SEN provision for cerebral palsy include classroom-based physical and learning adaptations, adapted lesson plans, access to learning support assistants and improved communication techniques (such as Augmented and Assisted Communication devices) to integrate national curriculum into teaching for children with cerebral palsy7. Furthermore, some children with cerebral palsy may also have access to therapy aimed at improving speech and language, and physiotherapy to improve movement and respiratory symptoms. In England, it is estimated that 93% of children with cerebral palsy have SEN support recorded at least once during primary school8.
There is limited understanding of the causal effect of SEN provision on health and academic outcomes in England. Evidence from government reports estimate that SEN provision is associated with worse absence9 and educational outcomes10. However, such reports do not account for the need of SEN provision. Randomised controlled trials (RCTs) have not been conducted to evaluate the effectiveness of SEN provision despite evidence of variation in the type and timing of provision, but in part this is due to the complications associated with trials and so-called “hard to reach” heterogeneous user groups. However, with the collection of administrative education and health data through publicly funded services, pragmatic real-world observational studies could be conducted to evaluate the comparative effectiveness of SEN provision in children with cerebral palsy. Whilst there is the risk of bias in observational studies such as that arising from uncontrolled confounding by indication, careful study designs, such as those guided by the target trial emulation framework11 may be able to achieve comparable exposed/unexposed groups in well-defined populations such as those with cerebral palsy.
We aimed to estimate the causal impact on children with cerebral palsy of assigning alternative categories of SEN provision at the start of primary school on health and educational outcomes during primary school using the target trial emulation framework to emulate a pragmatic trial.
Focus groups of young people, parents and service providers helped frame our research question. We gained insights from two separate meetings with stakeholders (parents, pupils and teachers) to understand the timing of when SEN provision mattered for educational development. We met with the Department for Education’s national young SEN advisory group (the Friendship, Learning, Achieve, Reach and Empower group) on the 18 of September 2021 and with the Young Persons Advisory Group for research at Great Ormond Street Hospital on 27 of November 2021. At both meetings, we introduced the pseudo-anonymised linked administrative dataset that was used in this study, the cohort this encompassed as well as the outcomes which were collected. Stakeholders were receptive to using such data for research and “public task”. Stakeholders at both meetings also help guided the design of the study by confirming school entry as a critical time for SEN provision, which guided our target trial emulation framework. We also used further feedback during these sessions to provide feedback to the data owners such as further outcomes which should be measured in future iterations.
The data used in our study was administrative data collected by English state-funded schools (the National Pupil Database - NPD) and hospitals (Hospital Episode Statistics - HES) using a national opt-out model for secondary usage (e.g. research and planning). Therefore, given the non-interference nature of the data, the study adheres to the Declaration of Helsinki. The legal basis behind accessing this data was “public task” under Article 6 of the General Data Protection Regulations. Sharing this secure data for the purposes of this study via the Office of National Statistics Secure Research Service was done in line with the Digital Economy Act 2017. Permissions to use these linked, de-identified data under our legal basis from Hospital Episode Statistics and the National Pupil Database were reviewed and granted by the NHS Digital (DARS-NIC-381972) and the Department for Education (DR200604.02B) review boards respectively. Ethical approval for the ECHILD project that links HES and NPD was granted by the National Research Ethics Service (17/LO/1494), NHS Health Research Authority Research Ethics Committee (20/EE/0180) and UCL Great Ormond Street Institute of Child Health’s Joint Research and Development Office (20PE16) review boards to ensure the study meets national and international guidelines for research on humans.
Accessing Hospital Episode Statistics for secondary usage (e.g. research) follows a national opt-out model in England; therefore, informed consent from patients was not required when HES is lawfully provided by NHS Digital (with institutional review board approval) in a pseudo-anonymised format that reduces identifiability for researchers. Further information on opting out of Hospital Episode Statistics for secondary usage can be found here.
We used the Education and Child Health Insights from Linked Data (ECHILD) database12, a pseudo-anonymised dataset linking the National Pupil Database (NPD) with Hospital Episode Statistics (HES). The version of ECHILD used for this study followed-up state funded education and health activity up to age 25 with a linkage rate of 95% between health and education data sources13. ECHILD contains data on sociodemographic characteristics as well as educational and health specific information. A detailed description of the dataset is available elsewhere12. ECHILD was selected due to its comprehensive coverage of state-funded education and healthcare services in England, capturing 95% of primary school pupils and 99% of all hospital activity in England.
We used the target trial emulation (TTE) framework to reduce bias by pre-specifying the population and hence which data to be extracted from ECHILD, the interventions to be compared, the start and duration of follow-up and the causal contrasts corresponding to our aims (Appendix Table 1).
Retrospective cohort study using linked National Health Service (NHS) data with state funded education data in England consisting of births between 1 September 2003 and 31 August 2013; consequently, the start of compulsory education (Age 5/6 – Year 1) started for this group between the 2008/2009 and 2018/2019 academic years.
The emulated target trial eligibility criteria for our population were live singleton births with a phenotypical recording of cerebral palsy in hospital admission data prior to Year 1. The cerebral palsy phenotype was defined using International Classification of Diseases revision 10 (ICD-10 G80. *) codes recorded in any hospital admission diagnosis prior to the start of follow up. We excluded children with codes identifying major congenital anomalies according to the EUROCAT study, in order to restrict competing needs for SEN provision14 (Appendix Table 2). We excluded children who were recorded to be in a special school because all children in special school receive SEN provision.
The intervention of interest was (recorded) SEN provision in mainstream education at the start of compulsory education (i.e. Year 1), referred to as “early SEN provision”. In England, SEN provision has two levels of intensity: SEN Support (previously known as Action, Action Plus or non-statemented SEN) and a more intensive Education Health Care Plan (EHCP, previously known as a Statement of SEN)15. The responsibility for organizing SEN Support is by the school whilst an EHCP is organised and partially funded by the child’s local authority of residence. Whilst SEN Support aims to provide equitable access to education through teaching assistants and specialised adaptive learning programmes in a general16 classroom, EHCPs provide more intensive support, including one-on-one care and additional support for learning.
Information on recorded SEN provision was extracted from the January NPD census of the year in which the pupil was enrolled in Year 1. It was categorised into three classes: No “early” provision (None), “early” SEN Support and “early” EHCP.
The start of follow-up was from January of Year 1, when early SEN was recorded. Follow-up continued until July of Year 6, loss to follow-up, or end of study (last academic year, defined as September to August) before the COVID-19 pandemic – 2018/2019), whichever occurred first. Loss to follow-up included transfers to special/non-state schools, home-schooling, death, emigration, or off-rolling (illegal exclusions17.
The outcomes of interest were unplanned hospital admissions (which could be an indication of health problems related to physical, behavioural or social complications or stresses arising from lack of SEN provision), school absences (total and unauthorised) and educational attainment during primary school. We quantified unplanned hospital admissions using admitted patient care records where the method of admission was recorded as unplanned; we derived information on absences using the termly absence data. Finally, we used mathematical assessments taken at age 6/7 (Key Stage 1 – KS1) and 10/11 years (Key Stage 2 – KS2) as indicators of educational attainment. We chose mathematics (as opposed to equivalent scores in English and Science) because of their predictive power for later educational outcomes16. As some children did not sit the exams, especially those at age 10/11 years, the outcome was defined as a binary indicator of whether a child achieved the government expected standards or not, such as “working towards”, with the former category including not taking the assessment.
We expressed the question of whether early SEN provision improves the outcomes of interest in our population in terms of the average treatment effect (ATE)18. In other words, we asked the question “What would happen if everyone were to be assigned a given level of SEN versus if no one were to be assigned SEN?" The further comparison of the two levels of SEN provision with each other was also expressed in terms of the ATE. Additionally, we asked the question of “What would happen if everyone who received a certain level of early SEN provision were given none?" This was expressed in terms of the average treatment effect on the treated (ATT)18. These questions concern early SEN provision only, and do not address the impact of whether this is sustained or not, i.e. mimicking intention-to-treat analyses. We did not consider delayed access to SEN.
ATEs and ATTs were expressed as incident rate ratios (IRR) for hospitalisation and absence rates, and risk ratios (RR) for expected level in mathematics at KS1 and KS2.
Socio-demographic, clinical and education factors with their assumed relationships are depicted in Appendix Figure 1 to account for of the relationship between SEN provision and our outcomes of interest in our observational data. In summary we included (Table 1): cerebral palsy phenotypes, an a-priori chosen set of chronic health conditions as per Hardelid et Al.19 , gestational age and weight at birth, racial-ethnic group, English as an additional language or not, the academic year in which they started year 1, neighbourhood income deprivation quintile, and standardised school readiness scores, called the early years foundation profile (EYFSP) in England.
All analyses were conducted in the Office of National Statistics Secure Research Service Trusted Research Environment using R version 4.4.0 (open source software). Our code is available at: https://github.com/UCL-CHIG/HOPE_Cerebral_Palsy_Target_Trial_Emulation
Descriptive statistics. We described the distribution of each covariate and each outcome by category of early SEN provision (Table 1).
Estimation methods. Estimation of each causal contrast was conducted using three approaches to understand the robustness of our results: regression adjustment, inverse probability weighting (IPW) of marginal structural models, and the parametric g-formula (Para-G). Detailed assumptions for performing each estimation approach have been described elsewhere20 but, briefly, IPW requires a correct specification of the relationship between exposure and confounders (the propensity score model) while regression adjustment and Para-G assume that the outcome model is correctly specified. Regression adjustment estimates the ATE when the parameters of the outcome model are collapsible, in which case marginal and conditional effects are the same; otherwise, regression adjustment would only estimate conditional effects.
Implementation of IPW used stabilised inverse probability weights via the propensity score, in this case the propensity for recorded SEN provision in Year 1. With multiple categories of treatment (None, SEN Support and EHCP) we created models for all pairwise comparisons: (i) None vs SEN, (ii), SEN vs EHCP and (iii) None vs EHCP. Using these models, we created propensity scores and graphically evaluated the overlap for each pairwise of exposures (i.e. to verify the positivity assumption).
To model unplanned hospital admissions, unauthorised absences and total absences we used negative binomial models due to over-dispersion in the data. The relevant variables were the number of days of unplanned hospitalization, and the number of authorised and total absences during follow-up, with denominators- respectively, the total number of days during follow up and the number of possible school sessions during follow-up. For KS1 and KS2 maths expected levels, we used modified Poisson regression with robust standard errors
Confidence intervals (CI) were estimated using 1000 bootstraps. Due to the low amount of missingness in covariate data (except for birth characteristics), we used the missing indicator method to account for missing data which has been shown to have minimal bias in standard epidemiological studies21
Sensitivity analyses. As hospital data records cerebral palsy only in patients who were admitted to hospital care, we extended our primary case definition of cerebral palsy (Appendix Table 2). Our alternative case definition also included Hemiplegia (G81), Paraplegia and tetraplegia (G82.0 – G82.5) and Diplegia and monoplegia (G83.0-G83.3).
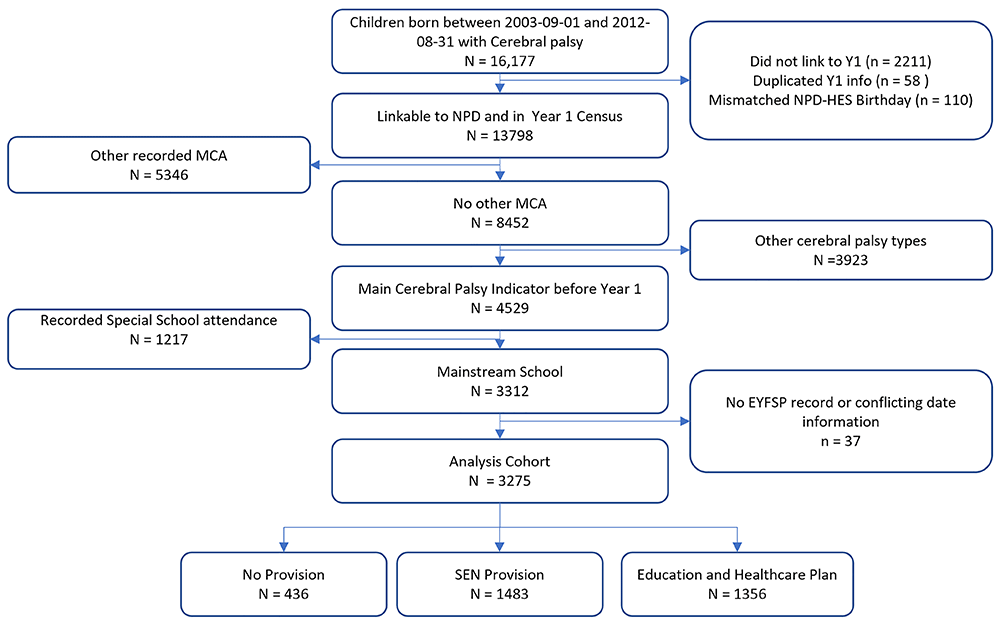
Between 2003 and 2013, we found 16,177 live singleton births with a recording of cerebral palsy. Of these, 13,798 were linkable to NPD, and 8,452 individuals had no recorded major congenital anomalies. When limiting to our primary definition of cerebral palsy, we had 4,529 individuals, 3,312 of whom started in a mainstream school with non-conflicting data (for example, errors in linkage denoting death before school start). Our main analysis consisted of 3,275 individuals, 436 with no early provision, 1,483 with early SEN Support and 1,356 with an early EHCP (Figure 1).
Boys were more likely to have any early recorded SEN provision than girls (Table 1). We also found that lower gestational age and birth weight were associated with higher proportions of recorded SEN provision. Provision was associated with lower EYFSP scores, higher area level deprivation and free school meal status. Pupils in schools with higher proportions of free school meals eligible pupils, higher rates of SEN provision and a higher pupil-teacher ratio also had a higher chance of receiving any early SEN provision. Children with recorded chronic conditions and those with additional forms of cerebral palsy also were more likely to be assigned to any early provision than those without.
Raw unplanned admissions rates were highest amongst children with recorded EHCP, followed by no SEN Support and then lowest in those with no provision (Table 2). Highest unadjusted rates off unauthorised absences were seen amongst SEN support pupils, followed by no SEN pupils, with the lowest rate observed in EHCP pupils. Rates of raw total absences were higher in those with early EHCP. Children with any provision were less likely to achieve expected levels at KS1 and KS2 mathematics and by KS2 this is driven by no record of an examination for children with an EHCP (i.e. 47.43% did not sit the exam).
Note: KS2 mathematics exams has reduced numbers due to limited follow-up for children born in the later years.
After graphically evaluating the density distribution of the propensity score for the pairwise comparisons of (i) SEN Support vs None (reference), (ii) EHCP vs SEN Support (reference) and (iii) EHCP vs None (reference) (Figure 2), we only found evidence of overlap, and hence positivity, for (i) SEN Support vs None (reference) and (ii) EHCP vs SEN Support (reference). Therefore, we only report results for these comparisons to avoid extrapolation of predicted outcomes.
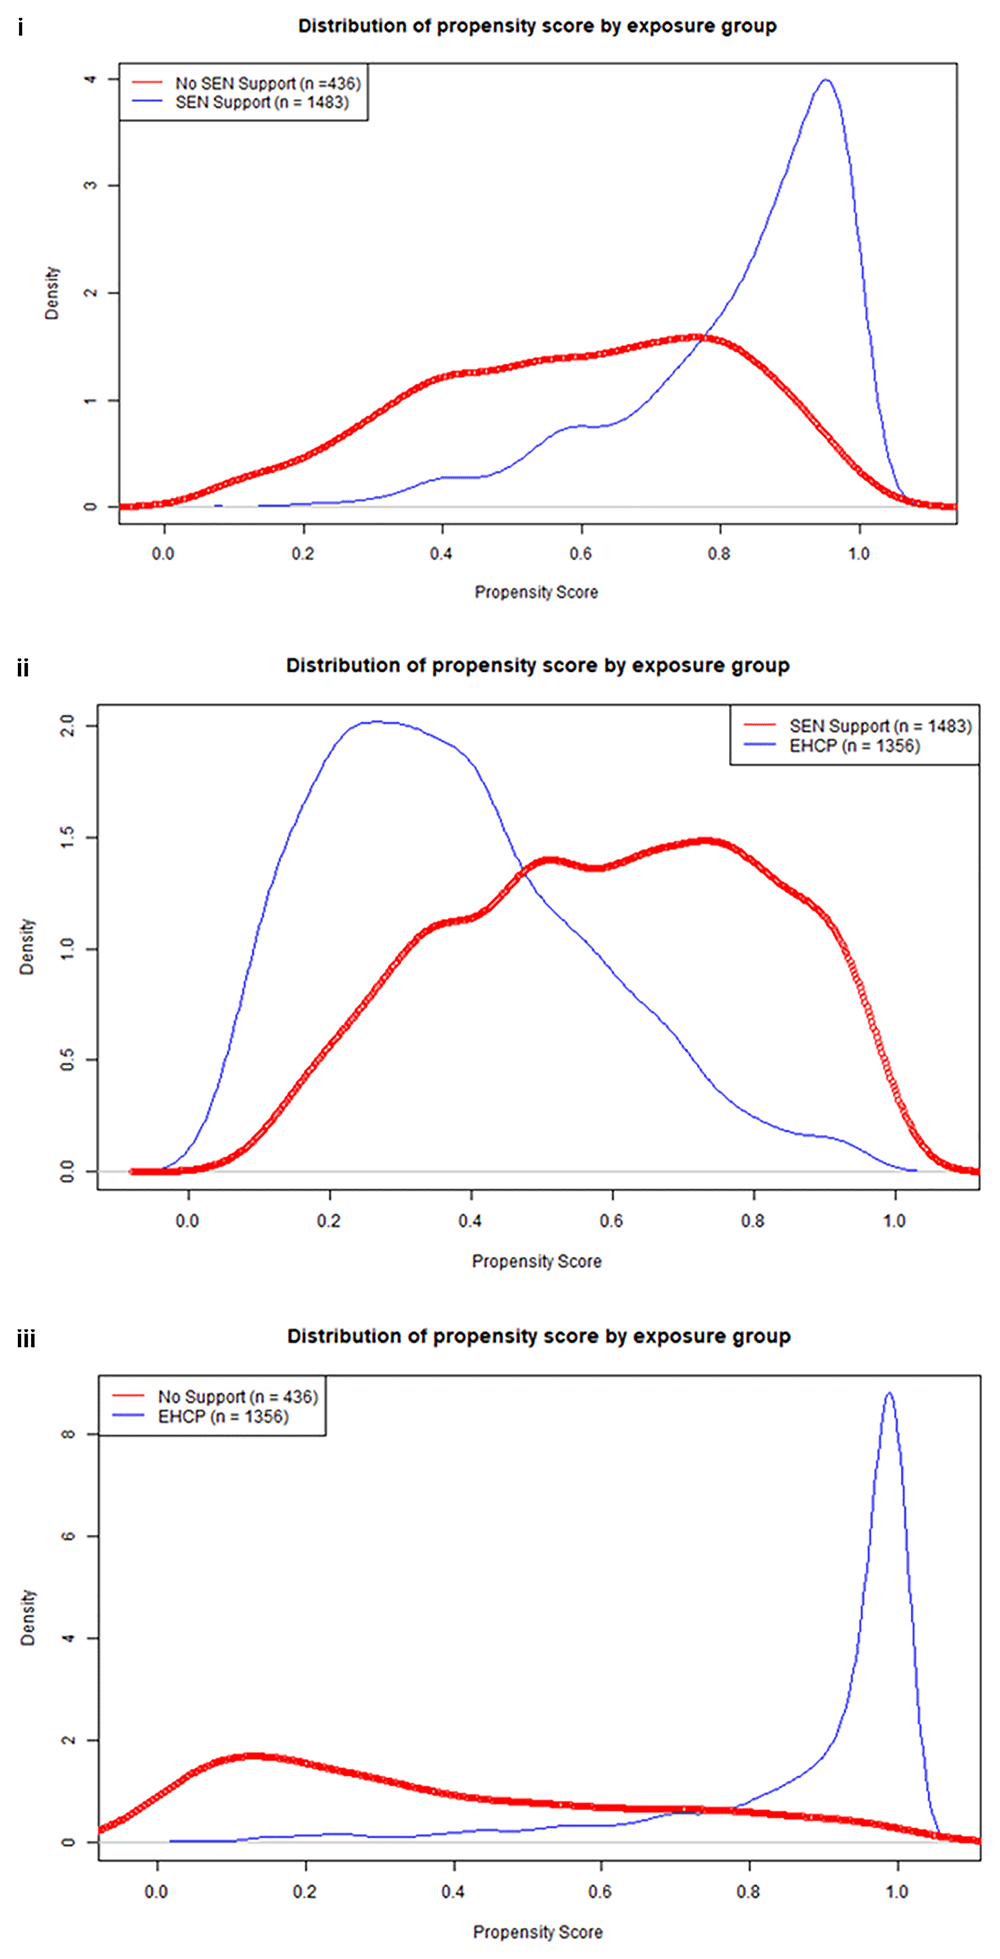
Density plots depicting distribution of estimated propensity for scores (i) SEN Support versus None, (ii) EHCP versus SEN Support and (iii) EHCP versus None; children with cerebral palsy born in 2003–2013 in England.
Unplanned Hospital Utilisation. Compared with no SEN provision, assignment to SEN Support produced elevated unplanned hospitalisation rates in terms of the ATE according to most estimation methods (Table 3): IRRRegression =1.93 (95% confidence interval (CI): 1.57, 2.37), IRRIPW =1.95 (95%CI: 1.37,2.79) and IRRpara-g =1.59 (95%CI 0.68, 1.96), Only the parametric g-formula produced confidence intervals including 1. We found higher rates of unplanned hospital admissions for pupils assigned to EHCP compared with SEN Support: IRRRegression =1.48 (95%CI: 1.39, 1.68), IRRIPW =1.44 (95%CI: 1.21, 1.74) and IRRpara-g =1.40 (95%CI: 1.14, 1.67) (Table 3). There was limited evidence of heterogeneity of effects, as the estimated ATTs were similar to their ATE counterparts and therefore we focus on the estimated ATEs.
Ref = Reference, IRR = Incident Rate Ratio; Ass. = Association, Cond Ass. = Conditional Association, ATE = Average Treatment Effect, ATT = Average Treatment Effect in the Treated, CI = Confidence Interval.
Absences. Children who were given SEN provision had similar rates of unauthorised absences compared with those with no support, IRRcrude = 1.17 (95%CI: 0.97, 1.42) (Table 4). Controlling for factors leading to SEN provision, we found instead evidence of no differential rates: IRRregression = 0.84: (95%CI: 0.70, 1.02) and IRRIPW = 0.91 (95%CI: 0.54, 1.36) or even of some reduction: IRRpara-g = 0.77 (95%CI: 0.47, 0.97) (Table 4). Assignment of EHCP instead of SEN Support appeared to lead to fewer, or similar, unauthorised absences with IRRregression =0.77 (95%CI: 0.66, 0.90) and IRRpara-g =0.78 (95%CI: 0.63, 0.94), IRRIPW =0.84 (95%CI: 0.67, 1.05) (Table 4).
Ref = Reference, IRR = Incident Rate Ratio; Ass. = Association, Cond Ass. = Conditional Association, ATE = Average Treatment Effect, ATT = Average Treatment Effect in the Treated, CI = Confidence Interval.
Assignment to SEN support had higher rates of total absences compared to no support, when using regression adjustment (Table 5; IRRregression = 1.19 (95%CI: 1.09, 1.30) but there was no evidence of a difference using the other methods: IRRIPW = 1.23 (95%CI: 0.99, 1.51) and IRRpara-g =1.11 (95%CI: 0.95, 1.27). Similar results were found when comparing EHCP to SEN Support : IRRRegression =1.06 (95%CI: 1.00, 1.13), IRRIPW =1.06 (95%CI: 0.97, 1.14) and IRRpara-g = 1.04 (95%CI: 0.98, 1.12).
Ref = Reference, IRR = Incident Rate Ratio; Ass. = Association, Cond Ass. = Conditional Association, ATE = Average Treatment Effect, ATT = Average Treatment Effect in the Treated, CI = Confidence Interval.
There was an apparent 42% reduction in the probability of expected KS1 Mathematics level when comparing any SEN versus none (Table 6): RRCrude = 0.58 (95%CI: 0.54,0.64). After accounting for confounding, the gap closed, particularly when using regression adjustment: RRRegression = 0.84 (95%CI: 0.77,0.93), RRIPW = 0.77 (95%CI: 0.66,0.92) and RRpara-g = 0.63 (95%CI: 0.54,0.80). Similar effects were found when estimating the impact of assignment of EHCP over SEN Support: the crude estimate was 37% lower [RRcrude = 0.63 (95%: 0.56 to 0.70)] but after adjustment this association was no longer observed (Table 6): RRRegression = 0.95 (95%CI: 0.86,1.05), ORIPW = 0.95 (95%CI: 0.85,1.05) and ORpara-g = 0.96 (95%CI:0.78,1.11).
In this analysis, we evaluate the risk of a recorded expected level in mathematics in Key Stage 1 or not (this includes both those who sat the exam and did not achieve the expected level as well as those who did not sit the exam). Ref = Reference, RR = Risk Ratio/Relative Risk; Ass. = Association, Cond Ass. = Conditional Association, ATE = Average Treatment Effect, ATT = Average Treatment Effect in the Treated, CI = Confidence Interval.
KS2 Mathematics assessments. For the 1117 children with sufficient follow-up to capture KS2 mathematics attainment, there was no association between SEN support (versus none) and reaching expected levels once accounting for confounders (Table 7):RRRegression = 0.90 (95%CI: 0.80,1.02), RRIPW = 1.05 (95%CI: 0.73, 2.20) and RRPara-G = 0.81 (95%CI: 0.68, 1.13). Assignment of EHCP was less likely than SEN Support to achieve expected levels at KS2: RRRegression = 0.84 (95%CI: 0.73 ,0.96), RRIPW = 0.86 (95%CI: 0.74, 0.99) and RRPara-G = 0.68 (95%CI: 0.55, 0.91).
In this analysis, we evaluate the risk of a recorded expected level in mathematics in Key Stage 2 or not (this includes both those who sat the exam and did not achieve the expected level as well as those who did not sit the exam). Ref = Reference, RR = Risk Ratio/Relative Risk; Ass. = Association, Cond Ass. = Conditional Association, ATE = Average Treatment Effect, ATT = Average Treatment Effect in the Treated, CI = Confidence Interval.
When extending our case definition of cerebral palsy to include hemiplegia, paraplegia and tetraplegia, and diplegia and monoplegia, our dataset increased to a total of 4707 individuals, 1056 with No early Support, 2076 with early SEN Support and 1575 early EHCP. Similarly to our main analysis, we could only conduct two of three pairs of comparisons: (i) No Provision vs SEN Support and (ii) SEN Support vs EHCP. Full details of the sensitivity analysis can be found in Appendix Table 3 to 8 and Appendix Figure 2 and 3. Broadly, the analytical results remained similar except for a few outcomes and comparison groups described below.
Firstly, for unplanned hospital admissions, when estimating assignment of SEN Support in reference to no early support, we found similar incident rates IRRIPW (0.89 95%CI: 0.57, 1.33), and reduced incident rates using IRRPara-G (0.52: 95%CI: 0.26, 0.78). Comparative effectiveness of EHCP vs SEN found similar elevated results to our main analysis. See Appendix Table 5.
For unauthorised and total absences and KS1 outcomes, our comparisons of SEN Support with No Support and EHCP with SEN Support gave similar results to our main analysis in terms of point estimates and confidence intervals. See Appendix Table 6 and 7.
For KS2 outcomes, in comparisons of SEN Support versus No Provision (reference), regression adjustment and the parametric g-formula found lower risk of achieving expected levels (in contrast to our main analysis): RRRegression (0.87, 95%CI: 0.79, 0.95) and RRpara-g (0.68, 95%CI: 0.58, 0.84). When estimating the impact of assignment of EHCP over SEN Support, all results were similar to our main analysis See Appendix Table 8.
In our study, 45% of children with cerebral palsy had recorded SEN Support in Year 1 whilst 42% had an EHCP. Assuming no uncontrolled confoundedness, we estimated that compared to no provision, assignment of SEN Support had similar-to-higher unplanned hospital admission rates, whilst assigning EHCP had higher admission rates compared to those with SEN Support. Whilst total absence rates were similar amongst comparable groups, we found some causal evidence of both assigning SEN Support versus None and EHCP versus SEN in reducing unauthorised absences. At KS1, assignment to EHCPs had similar levels of attainment in mathematics to those with SEN Support, but assignment to SEN Support were less likely to achieve expected levels when compared to assignment to no support. By KS2, SEN support and no support produced similar levels of attainment, but assignment to EHCPs were less likely to achieve expected levels than those with SEN support. We conducted further sensitivity analysis to create a more inclusive case definition of cerebral palsy, for which most results were confirmed.
Using ECHILD allowed us to have a relatively representative cohort given the “near universal” coverage of state funded educational and hospital data for our cohort of children with cerebral palsy without major congenital anomalies. This universal coverage, in conjunction with the target trial emulation framework, allowed us to emulate a “population” pragmatic trial with observational data whilst reducing confounding-by-indication through mapping the properties of observational data onto an ideal prospective trial to create an analogous eligibility criterion, and appropriate start of follow-up. We evaluated the appropriateness of our comparison groups, leading us to avoid extrapolation of comparing data between No support and EHCP groups. We also used multiple estimation methods to evaluate the consistency of our results under different assumptions. The majority of our sensitivity analyses demonstrated similar results to our primary analysis.
Whilst using target trial emulation and causal methods reduce confounding-by-indication, unmeasured confounding could still impact results generated from observational data. For example, the ECHILD dataset does not measure predictors such as family composition, parental health or educational literary or the early home learning environment which are all predictors of KS1/2 outcomes22. We hypothesize increased home learning environments would reduce the probability of provision whilst increasing KS1 and KS2 outcomes. Furthermore, whilst the target trial emulation framework helped us reduce heterogeneity through exclusion of competing needs for provision (i.e. major congenital anomalies), and adjustment of chronic conditions, there could still be further unmeasured health related confounders. For example, data on impairment and functionality of the children which are more likely to increase the probability of SEN provision and unplanned hospital usage.
Gestational age and birthweight data were missing for nearly 30% and 22% of our cohort respectively. We assumed this was missing at random and accounted for missingness using the indicator method. Via regression adjustment we accommodated the drivers of missingness in gestational age and birthweight data, by including sociodemographic variables and clinical variables which are known to be related to them.
Finally, through our patient and participant involvement (PPI), we acknowledge that an early recording of provision (or none) in administrative records does not necessary reflect actual delivery of support, as there could be delay or failure to provide provision. One teacher PPI group also suggested that some pupils may be given support prematurely to an EHCP award given a-priori knowledge of need and/or in the process of an application for an EHCP. Therefore, the effect of EHCP over SEN Support maybe a conservative estimate.
Our results indicate that in children with cerebral palsy without coexisting congenital anomalies, there is limited evidence that early SEN provision would lead to improvements in the unplanned hospital utilisation, total absences or KS1 and KS2 mathematics outcomes. However, these findings should be interpreted with caution due to potential measurement limitations, unmeasured confounding, and the possibility that SEN provision impacts outcomes not captured in our analysis, such as well-being, or long-term academic engagement. It is imperative to state that our work does not advocate for the abolition of the SEN system in England, as it is vital that children who need provision, including those with cerebral palsy get access to effective support. Our goal is to contribute to the evaluation of the current system and provide evidence for iterative improvements to the SEN system that is current overstretched and is not able to keep up with the increased trend for the needs for the special education provision in England23.
For some outcomes, e.g. absences, our findings contrast with previously published reports24,25. Our findings indicate that there is some evidence that SEN Support and EHCPs reduce the recording of unauthorised absences relative to no Support and SEN support. This is because unauthorised absences may lead to fiscal punishment for parents26 on top of inappropriately classifying children with cerebral palsy with truancy. Therefore, by choosing a population of similar need for provision, and with careful study design such as exclusionary criteria guided by a target trial emulation framework, we demonstrated a positive effect of provision on the recording of unauthorised absences not previously reported. However, these results should be interpreted with caution; since we found similar rates of total absences, reduced unauthorised absences could be a sign of recoding to authorised absences.
We found that children with early EHCP had similar levels of attainment in KS1 mathematics expected level compared to those with SEN Support but lower expected levels at KS2.We also found that compared to No provision, early assignment to SEN Support produced lower proportions of those expected to reach the government set level in mathematics in KS1 but having similar proportions by KS2. Our findings are similar to prior research27,28. The educational benefits of SEN might not be detected due to a plethora of reasons including unmeasured confounding (e.g. severity measures of learning disabilities), because the intension of provision was not met, because provision produced unintended consequences such as lowered expectations29, or because the impact of the intervention had not had enough time to permeate.
Our mixed findings warrant further evaluations of SEN provision. Our work assumes the universal need for provision based upon a phenotypical recording of cerebral palsy in hospital admission records, but found 13% of children with cerebral palsy do not have provision by the start of primary education. It is therefore important to capture why these children, and in general, all children in the national database are suspected (or not) to need provision in addition to whether they have provision or not (what is currently recorded). Our work also assumed unplanned hospital utilisation, absences and KS1/2 outcomes were the targets that SEN provision could improve; future iterations of the NPD should consider capturing the specific outcomes that provision aimed to improve. Furthermore, there needs to be a measure of whether recorded SEN is provided, analogous to the need to understand adherence rates in pharmaco-epidemiology studies; such data would allow researchers and SEN practitioners understand the determinants of sustained provision and not just recorded provision. Finally, the NPD should also explore further methods for capturing teacher and practitioner benefits and limitations they believe are associated with SEN provision.
Provide sufficient details of any financial or non-financial competing interests to enable users to assess whether your comments might lead a reasonable person to question your impartiality. Consider the following examples, but note that this is not an exhaustive list:
Sign up for content alerts and receive a weekly or monthly email with all newly published articles
Register with NIHR Open Research
Already registered? Sign in
If you are a previous or current NIHR award holder, sign up for information about developments, publishing and publications from NIHR Open Research.
We'll keep you updated on any major new updates to NIHR Open Research
The email address should be the one you originally registered with F1000.
You registered with F1000 via Google, so we cannot reset your password.
To sign in, please click here.
If you still need help with your Google account password, please click here.
You registered with F1000 via Facebook, so we cannot reset your password.
To sign in, please click here.
If you still need help with your Facebook account password, please click here.
If your email address is registered with us, we will email you instructions to reset your password.
If you think you should have received this email but it has not arrived, please check your spam filters and/or contact for further assistance.
Comments on this article Comments (0)