Keywords
Type 1 Diabetes, Population Screening, Health Economics, Cost-Effectiveness
Type 1 Diabetes, Population Screening, Health Economics, Cost-Effectiveness
Type 1 diabetes (T1D) is a common long-term condition, with 32,809 children and young adults in England and Wales receiving care at pediatric diabetes units in 2023/241. T1D results from the autoimmune destruction of pancreatic beta cells and requires lifelong replacement with the deficient hormone insulin via multiple daily injections or insulin pump therapy. At diagnosis, nearly all children present with symptoms needing urgent insulin treatment and hospital admission, with 38% in the life-threatening state of diabetic ketoacidosis (DKA)2. DKA is associated with shock and neurocognitive deficits and has also been associated with long-term hyperglycemia, a known predictor of adverse long-term health outcomes through the development of macrovascular (e.g., myocardial infarction (MI), stroke, heart failure) and microvascular complications (e.g., foot ulcers, blindness, renal disease) of T1D3–5. There is potential for earlier detection through screening because T1D develops before symptom onset, with well-recognized stages, hallmarked by the onset of two or more islet-specific autoantibodies with the presence of normoglycameia (stage 1), dysglycemia (stage 2), and symptomatic type 1 diabetes (stage 3)6.
The majority (> 85%) of children presenting with T1D and those who present with DKA do not have a family history of the disease7. This means that, to make a meaningful difference in the early identification and prevention of DKA, a general population screening strategy would need to be implemented. Outside of the UK, T1D screening approaches in both the general population and higher-risk populations (e.g., children with T1D genes that are associated with a higher risk of developing T1D or having first-degree relatives with T1D) have demonstrated that early detection of T1D has clinical benefits. In Germany, when more than 90,000 children aged 1.75–5.99 were screened for T1D, 280 (0.31%) had presymptomatic type 1 diabetes8. The TEDDY study found that a cohort who was identified and intensively monitored had a statistically significantly lower probability of presenting with DKA at diagnosis (11.3%) in some similar cohorts of children who did not receive this follow-up (36.4%, 25.3%), but not others (16.9%, 18.7%)9. If DKA at diagnosis could be prevented, this would mean that children with T1D do not need to be hospitalized at the start of insulin treatment, they present earlier with a lower glycated hemoglobin and higher residual pancreatic function (C-peptide), making the disease easier to manage and more available for disease-modifying therapies10,11.
In the UK, the National Screening Committee (NSC) requires scientific evidence for a proposed screening program, including the accuracy of the test, benefits of early detection to improve outcomes, any harm or side effects associated with the test or treatments, whether it would significantly improve overall health in the population, and most relevant to this study–cost-effectiveness: would screening be a good use of healthcare resources? If the benefits of screening cannot be obtained at an acceptable cost, it is unlikely that the NSC would consider screening for T1D12. Consequently, developing an early economic analysis can inform us whether screening that prevents DKA is potentially economically viable. If it is not, what other benefits would screening for T1D have for children identified as having T1D for screening to be cost-effective? This helps inform what research should be conducted on the benefits of screening in the future to establish whether screening for T1D is cost-effective.
We conducted a cost-utility analysis of a potential general population-screening program for T1D in England and Wales. Given that definitive randomized controlled trials do not currently exist, we calculated the screening programme could cost per child screened in the general population to obtain an Incremental Cost-Effectiveness Ratio (ICER) of £20,000 per quality-adjusted life year (QALY) gained. We explored several scenarios of differing treatment effects associated with general population screening for T1D.
A PPI group of parents (1 one whom did not have experience of T1D) was established prior to submitting the bid, and the group was involved throughout. The parent of a child diagnosed with T1D was a full member of the project management group and contributed to the design of the economic analyses. The results of the economic analysis were then presented to a group of parents with T1D.
Our population was the general population of children aged 4 years because we believed that this would be the optimal age for a single screen test, and if implemented, this could be done at the same time as the pre-school vaccination in the UK. The general population comprised 50% males. The population diagnosed with T1D was assumed to be 52% male based on National Paediatric Diabetes Audit (NPDA)13.
Our study used the English and Welsh NHS setting. Consequently, we followed the National Institute for Health and Care Excellence (NICE) guidelines and took an NHS and personal social services perspective, discounted future costs and QALYs at 3.5% per annum, and took a lifetime horizon14.
The intervention considered was a screening test to detect T1D in every child in England and Wales, aged 4. To detect T1D in the general population, we assumed that the screening program would perform identically to the screening program presented by Ziegler et al. in Germany8.
QALYs were the key measures of benefits and harm. The key benefits of screening included prevention of DKA at diagnosis and potential long-term benefits from preventing DKA at diagnosis in scenario analyses.
For our base case, we applied a hazard ratio to reduce the probability of DKA presentation compared with the control arm.
Utilities for health states in the model were sourced from the literature with values based on the EQ-5D self-reporting by populations of interest, valued using the England and Wales EQ5D3L value set, which were preferred in line with NICE guidance15–17.
All costs in the economic model are in pounds sterling and are 2020/21 prices. The costs from previous price years were inflated to 2020/21 prices using the NHSCII inflation index18.
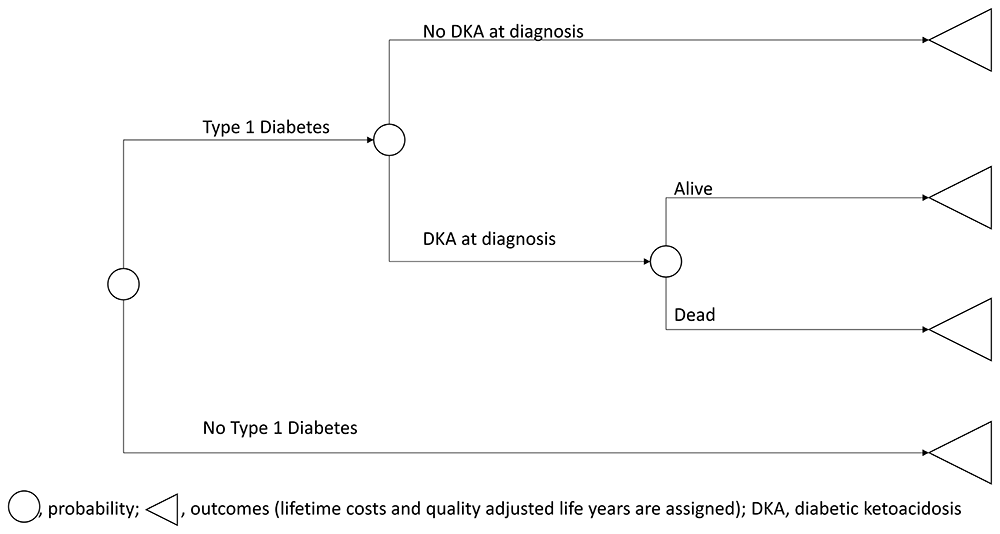
Figure 1 shows the decision-tree structure for a single strategy (screening or no screening). The population enters the model and is assigned as either truly having T1D or not having T1D. For the population subgroup without T1D, their quality-adjusted life expectancy was estimated using Office for National Statistics (ONS) lifetables to estimate their life expectancy and age-gender norms for utility19,20. For the population with T1D, we assumed for simplicity that they developed T1D immediately. The population subgroup with T1D was split into two further subgroups, one who developed DKA at the time of diagnosis and the other who did not. In the screening arm, a lower probability of having DKA is applied than in the no-screening arm; in the base case, this is the only benefit of screening. Then, the proportion of the population present in the DKA is assumed to be present immediately and can either survive or die from the DKA. Therefore, fewer children with T1D will die if they undergo screening, as fewer of these children have DKA. As they develop T1D immediately, this means that our estimates will be slightly favorable to screening, as the costs and utility decrements due to DKA will not be discounted because they occur in the future. The probability of death is taken from the NPDA in the base case. For the proportion of the population that has a DKA at diagnosis, every child was assumed to have an admission for their DKA, and an associated cost was added to their overall costs of treatment19. For the proportion of the population that has T1D and survives (either with or without an initial DKA at diagnosis), their estimated lifetime costs and QALYs are estimated using a modified version of our individual-level simulation model designed to estimate outcomes for adults with T1D21. In the base case, these projections of lifetime costs and QALYs are the same in both the screening and no screening arms. Scenarios of long-term benefits of HbA1c, severe hypoglycemia, and future DKA (which will change the projected lifetime costs and QALYs for children with T1D) were explored in scenario analyses.
In a decision tree, the expected probability that each outcome occurs is multiplied by the expected costs and QALYs of that outcome to generate the expected outcome. All expected outcomes are added together to provide the overall expected costs and QALYs.
Analytics, assumptions and study parameters
Clinical probabilities
A summary of the clinical probabilities used in the economic model is presented in Table 1. Detailed descriptions of the evidence base are provided in the subsequent sections.
| Parameter | Value | Source |
|---|---|---|
| Probability that a child without T1D is male | 50% | Assumption |
| Probability that a child with T1D is male | 52% | NPDA, proportion of children with newly diagnosed T1D who were male with an age of diagnosis between 4 and 1813 |
| Probability (proxied by cumulative incidence) of T1D post screening | 0.31% (280/90632) | Ziegler et al.8 |
| If a child has T1D, the probability of having a DKA at diagnosis for current practice | 38.5% | NPDA, 2019/20 data22 |
| Hazard ratio for the effect of screening on the incidence of DKA at diagnosis | 0.2 | Assumption used in a power calculation for a proposed trial of general population screening programme for T1D |
| If a child has T1D, the probability of having a DKA at diagnosis for children who are screened | 9.3% | Calculated based on probability for current practice and the hazard ratio* |
| Probability of death from DKA at diagnosis | 0.03% (4 / 14363) | NPDA22,23 |
T1D, type 1 diabetes; NPDA, national paediatric diabetes audit
*, the calculation to produce this number is as follows
1) Hazard of DKA at diagnosis no screening = -(ln(1-probability of DKA at diagnosis)
2) Hazard of DKA at diagnosis screening = Hazard of DKA at diagnosis no * Hazard Ratio
3) Probability of DKA at diagnosis screening = 1 – exp(-hazard of DKA at diagnosis screening)
Probability of having T1D
We used the study by Zeigler et al., which was a prospective cohort study of screening in the general population of children aged 1.75–6 years in Bavaria, Germany8. They found that 0.31% of their population developed T1D. We assumed that this percentage would be relevant for screening individuals aged 4 years in England and Wales. This is based on age 4 being approximately in the middle of this age range, clinical advice, and the fact that the study was conducted in Germany, which we would expect to be similar to an English and Welsh setting8.
Probability of having a DKA at diagnosis, if the child has T1D
Based on the most recent NPDA data for 2019/20, we assumed that in the absence of screening, 38.5% of children with T1D would have a DKA event at their diagnosis22. For children who were screened, we assumed that there would be an 80% reduction in their risk of having a DKA at diagnosis (this is implemented as a Hazard Ratio of 0.2, as we expected this evidence to be generated in a time-to-event analysis). This was sourced from our early work that performed power calculations for subsequent randomized controlled trials of screening, with DKA prevention as the primary endpoint. This was based on the observed effectiveness. This gave the probability that a child who was screened and developed T1D would have DKA at a diagnosis of 9.3%.
Probability of dying from DKA at diagnosis
From the most recent NPDA report on childhood outcomes, there were four deaths related to DKA (but not specifically DKA at diagnosis) in children aged 0–14 between 2015–2023. In the NPDA, 14,363 DKA events were detected over this period22. This gives a 0.03% conditional probability that a child, given that they have a DKA at diagnosis, could die from this event.
Decision tree outcomes
People without T1D
For people without T1D, we estimated their life expectancy from the Office for National Statistics (ONS) life table mortality data19. To get their utilities, we used values reported by the NICE decision support unit (DSU) by age and gender for the English and Welsh population20. As the NICE DSU data is only valid for adults, we assumed that all children would have the same utility as a 16 year old from this analysis. These data were combined to estimate the expected QALYs of this population. This gave a predicted life expectancy of 77.30 years, when applying utilities were applied, a total quality-adjusted life expectancy of 67.02 QALYs, when discounted, was applied at 3.5% per annum, which gave a discounted quality-adjusted life expectancy of 24.61 QALYs.
People with T1D, who die from a DKA at diagnosis
We assumed that the death caused by DKA occurred on the day of diagnosis. Therefore, we included people who died from DKA at a diagnosis of 0 QALYs.
This incurs a treatment cost for the treatment of DKA. This was £3,278, which was obtained from the National Schedule of Reference Costs24, Currency Code PK67A (Paediatric Diabetes Mellitus, with Ketoacidosis or Coma, with CC Score 1+) and PK67B (Paediatric Diabetes Mellitus, with Ketoacidosis or Coma, with CC Score 0). This was estimated as a weighted average from all the times these currency codes were used in 2020–21.
People with T1D who do not die from DKA at diagnosis
To reflect the expected costs and QALY outcomes of our population we conducted a run of our Sheffield Type 1 Diabetes Policy model21. This model was run using 2015/16 prices and then the total discounted costs over an average child with T1D’s life expectancy was inflated to 2020/21 prices.
In this analysis, we used our baseline characteristics from the NICE guidelines for modelling CGM in adults and did not allow any risk factors to change over time. We set the age to 4 and the proportion of males to 52% based on NPDA data:
The probability of having subsequent DKAs and severe hypoglycemia was taken from NPDA data on the probability of having a DKA or severe hypoglycemic event by diabetes duration22. We assumed that one event occurred per person per year, due to the absence of information on the number of events that occurred per year. We assumed that the probability of having DKAs in the group with the highest diabetes duration in the dataset was maintained for the rest of the patient’s lifetime.
We adapted our model so that simulated individuals could not develop diabetes-related complications (cardiovascular disease, retinopathy, macular edema, neuropathy, or nephropathy) until they were 18. The model estimated lifetime costs and QALYs for this population. We took annual costs for managing T1D from evidence submitted to NICE as part of their appraisal of hybrid closed-loop technology (TA943, £5,387per year on insulin and devices and £575 per year for contacts with health care professionals)25.
In addition, the cost of presenting with DKA at diagnosis and a utility decrement associated with DKA (for children who survived their DKA at diagnosis) were also included, which was done in our decision tree and not in the long-term model being used to generate quality-adjusted life expectancy. A summary of the expected lifetime discounted costs and QALYs for these children with T1D are given in Table 2 and a summary of the baseline characteristics used in the Sheffield T1D model are given in Table 3.
| Parameter | Value | Source |
|---|---|---|
| Discounted lifetime QALYs lived for a child with no T1D | 24.61 | ONS life tables19, Hernández-Alava et al.20 |
| Costs for children with no T1D, excluding screening | £0 | Assumption, as only T1D specific costs are in economic analyses in the England and Wales. |
| Discounted lifetime QALYs lived for a child with T1D, no DKA at diagnosis | 20.001 | Calculated for this study using an adapted version of the Sheffield Type 1 Diabetes Model for adults with T1D26 |
| Costs for children with T1D, no DKA at diagnosis (discounted over lifetime) | £201,088 | Adapted version of the Sheffield Type 1 Diabetes Model for adults with T1D26 |
| Utility change associated with DKA | -0.0091 | Peasgood et al.27 |
| QALYs lived for children with T1D, DKA at diagnosis, died | 0 | Assumption |
| NHS Costs for children with T1D, DKA at diagnosis, died | £3,278 | NHS reference costs for treating paediatric DKA – Activity Weighted Average of Currency Codes PK67A and PK67B24 |
| QALYs for children with T1D, DKA at diagnosis, survive | 19.992 | Calculated for this study using an adapted version of the Sheffield Type 1 Diabetes Model for adults with T1D + utility change associated with DKA |
| Costs for children with T1D, DKA at diagnosis, survive | £204,366 | Adapted version of the Sheffield Type 1 Diabetes Model for adults with T1D + an additional cost for DKA at diagnosis from NHS reference costs for treating paediatric DKA– Activity Weighted Average of Currency Codes PK67A and PK67B24 |
| Mean | Standard Deviation | Source | |
|---|---|---|---|
| Baseline Characteristics | |||
| Age | 4 | Fixed | Target population |
| Probability that a child with T1D is male | 52% | Fixed | NPDA13 |
| HbA1c (%) | 9.1 | 1.7 | NICE28 |
| SBP (mmHg) | 131.3 | 16.3 | NICE28 |
| LDL (mmol/L) | 1.3 | 0.42 | NICE28 |
| HDL (mmol/L) | 0.74 | 0.19 | NICE28 |
| Triglycerides (mmol/L) | 0.28 | 0.2 | NICE28 |
| Ethnicity | White | N/A | NPDA13 - predominant ethnic group out of White, Black or Hispanic (ethnic groups used in our model) |
| Other key model parameters | |||
| Ongoing annual cost of diabetes treatments | £5,387 | HCL cost is from NICE TA943, (Final Appraisal determination committee papers, EAD addendum, Table 16)29 + annual insulin costs from Asgharzadeh et al. (page 199)30. Costs were deflated to 2015/16 prices to match the other costs in the model using the NHSCII pay and prices index31. | |
| Ongoing annual cost of diabetes related contacts | £575 | Annual cost of ongoing hospital visits from Asgharzadeh et al. (page 200)30. Costs were deflated to 2015/16 prices to match the other costs in the model using the NHSCII pay and prices index31. | |
| Probability of having a DKA event post diagnosis in 2019/20, with a diabetes duration of: | |||
| Under 1 year | 1.9% | NPDA22, Figure 14 | |
| 1 to 2 years | 3.9% | NPDA22, Figure 14 | |
| 3 to 4 years | 5.1% | NPDA22, Figure 14 | |
| 5 to 9 years | 6.1% | NPDA22, Figure 14 | |
| 10+ years | 6.2% | NPDA22, Figure 14 | |
| Probability of having a hospitalised severe hypoglycaemia event in 2019/20 with a diabetes duration of: | |||
| Under 1 year | 3.20% | NPDA22, Figure 19 | |
| 1 to 2 years | 2.60% | NPDA22, Figure 19 | |
| 3 to 4 years | 2.20% | NPDA22, Figure 19 | |
| 5 to 9 years | 1.90% | NPDA22, Figure 19 | |
| 10+ years | 1.80% | NPDA22, Figure 19 | |
| Probability that a severe hypoglycaemic event results in a hospitalisation | 0.25 (25/101) | Hammer32, Table 5 | |
| Parameters for scenario analyses | |||
| Hazard ratio for having a DKA post diagnosis (DKA at diagnosis v no DKA at diagnosis) | 0.55 | Karges et al.33 | |
| Hazard ratio for having a severe hypoglycaemic event (DKA at diagnosis v no DKA at diagnosis) | 0.80 | Karges et al.33 | |
People with T1D
The assumptions on costs and QALYs incurred by this population group were the same as those of the population with T1D who did not die from DKA at diagnosis; however, they did not incur the cost of treating their DKA at diagnosis or the associated utility decrement.
We ran our analysis without any assumed costs for screening, as it is too early at this stage to estimate the cost of a general population screening program for T1D. What we did Instead, we calculated the cost of screening to provide an Incremental Cost-Effectiveness Ratio (ICER) of £20,000 per QALY gained. The ICER is calculated as:
Where the cost of screening itself is not included in the screening costs
We rearranged this to give:
We used an ICER of £20,000 per QALY gained, as this is usually the lower end of the range of ICERs that the NICE considers acceptable. This provides an upper limit on the cost of screening, given the expected costs associated with T1D and the associated QALYs of people being screened.
Characterizing heterogeneity
No subgroup analyses were explored
Characterising distributional effects
No adjustment was made to reflect the priority populations, as this study concerns the feasibility of general population screening.
As we were developing an early model to identify key drivers for an economic screening case, we did not include any probabilistic analyses that would be expected in any economic evaluation of an actual screening program. The primary reason for this is that the most important uncertainty relates to the effectiveness of the screening program in reducing the number of people whose first knowledge of T1D is being diagnosed as an emergency in a hospital with a DKA. We do not yet have data on the effectiveness of an English-and-Welsh screening program and the statistical uncertainty in this effectiveness. We conducted a series of scenario analyses to explore the uncertainty in the true values of the model inputs.
We conducted 15 further exploratory analyses to explore the scale of the impact of other potential effects of a screening program beyond the DKA at diagnosis. The exploratory analyses were as follows:
1) We explored changing the Hazard Ratio for screening between 0.1% and 1 in increments of 0.1. The base case had a Hazard Ratio of 0.2. These were performed as scenarios 1a – 1h.
2) Reduced HbA1c in the long-term: A few but not all studies have shown that children who are screened have a long-term improvement in their HbA1c levels. Based on Lungdren et al. who showed that HbA1c of screened children was improved by 0.3% to 0.6% over a 5 year follow up compared to non-screened children in Southern Sweden, we added a -0.5% benefit in HbA1c associated with screening to the our long term economic model34. We did 4 sub scenarios:
3) Reduced subsequent DKA and severe hypoglycemia: We added a hazard ratio for the occurrence of future DKA and future severe hypoglycemia, which gives people who had DKA at diagnosis a higher rate of DKA and severe hypoglycemia than those who did not. The HR we used were 0.55 for DKA and 0.80 severe hypoglycaemic events. This was based on Karges et al., who weighted the HR they reported for sporadic and familial diabetes by the proportions of these patients in the baseline characteristics table33. These were applied for a lifetime. We conducted five scenarios, in which there was a benefit of screening for reducing DKA at diagnosis, as well as the assumption that the other benefits of screening were:
4) Increased mortality rate for a DKA diagnosed child:
a. We used data from Gibb et al. to determine the probability of dying from DKA instead of NPDA data. They found that out of 628 cases of DKA in their hospital, one patient’s death record mentioned DKA as the cause of death. In this scenario, we consequently altered the probability of dying given a person having a DKA from the base case of 0.03% to 0.16% (1/628)35.
b. We obtained data from the ONS regarding causes of death by age. We found 80 deaths from endocrine, nutritional, and metabolic diseases (ICD-10 code E00-E90) in 2022 in England and Wales in people aged between 28 days and 14 years. In this scenario, all 80 deaths were assumed to be caused by DKA at diagnosis. The next age band in this data was 15–44, so we did not include data from this age group because almost all people in this group will be adults with T1D. The National Pediatric Diabetes Audit found 3,457 new diagnoses of T1D in children and young people. In this scenario, the probability of death due to DKA at diagnosis was 2.31% (80/3457).
5) The cost of DKA was changed to use the 2021/22 NHS cost collection rather than 2020/21. This changed the cost of DKA to
6) Incorporate full NHS cost of diagnosis - Applied a cost of £8,935 to every child who developed T1D and did not die from a DKA at diagnosis, instead of the base case cost of £3,278. This was sourced from McCaroll et al., which is the total NHS and personal social services cost they attributed to in-hospital care for diagnosis of T1D36. This was not included in the main analyses to avoid double counting of DKA at diagnosis cost for children with T1D, who had a DKA at diagnosis and who survived their DKA.
7) We set the proportion of patients with T1D to 100%. This is a crude scenario to check whether there is value in preventing DKA at diagnosis if we had a population that solely consisted of children who had or would have T1D.
A summary of the discounted quality-adjusted life expectancy and costs for children with T1D across our conservative and exploratory analyses is presented in Table 4.
Our results, using only the clinical data that would be generated from an RCT of screening for T1D designed to detect a difference in the incidence of DKA at diagnosis, are given in Table 5. This shows that in this analysis, we would need the cost of screening to be under £3.17 per child screened (i.e., including the costs for children who do not develop T1D) for a screening program to have an ICER of £20,000 per QALY gained. This is an important threshold for an ICER, as this is the lower end of what NICE usually uses to determine the cost-effectiveness of health technologies and strategies in the English and Welsh NHS, and is also used by the National Screening Committee.
Our scenario analyses, which explore whether other benefits of screening for children with T1D can be proven, are given in Table 6. Table 6 shows that if we can find other substantial benefits (other than reducing the risk of DKA at diagnosis) from screening for children with T1D, the maximum acceptable cost of screening and follow-up could increase to approximately £50 per child screened. Other scenarios with large impacts on cost-effectiveness include setting the population to all have T1D, increasing the probability of death from DKA, and assuming that all deaths in patients under 14 years of age due to endocrine disorders were due to DKA at diagnosis.
Our analyses show that if the only benefit of screening is preventing DKA at diagnosis, then there is very little chance that a general population screening program for detecting T1D would be justifiable on economic grounds, as the maximum screening cost would be in the region of £3.17 per child screened. This average cost would need to cover all aspects of the screening program, including, but not necessarily limited to, inviting all children to be screened, testing the children, and providing support to any children who test positive (including false positives). Any other economic effects not included in the model, for example, overdiagnosis of T1D, would also need to factor into this cost.
The key reason for this is that T1D is rare in the general population and when the benefit of preventing DKA is spread across a whole screening population, this benefit is on average small. If the benefits of screening other than preventing DKA at diagnosis alone can be proven, this could drastically improve the maximum acceptable cost of screening to over £40 per child screened. Incidental findings or screening for multiple conditions could further increase the maximum cost of screening as they may bring additional benefits to the overall screening program.
The key strength of this study is that it addresses the screening costs in England and Wales in various scenarios. This gives us a good idea of what screening could cost in the UK, and what would be the key clinical factors if demonstrated to be the most likely scenario when screening.
Through the scenarios on screening affecting long-term biomedical outcomes, this not only covers scenarios where metabolic control is improved, regardless of the cause. This could be related to preventing DKA at diagnosis or by preventing the psychological trauma of an acute and life-threatening DKA in a previously healthy child. By calculating the mean cost, we could not specify any particular part of the screening design. Therefore, the work is translatable to a variety of potential screening programs with different invitation strategies, tests, follow-up testing schedules, and support programs or interventions to reduce the incidence of DKA for parents and children who test positive for T1D (we do expect that there will be some false positives).
As this was an early analysis, there are many limitations that should be considered when interpreting the results. The key limitations of our study are as follows.
This study does not include the costs or effects of teplizumab, an agent for delaying the onset of stage 3 T1D which is currently undergoing assessment by NICE in a population aged over 8 with stage 2 T1D37. We did not include this, firstly we do expect that many children that would be identified in a screening programme for 4 year olds would remain free of T1D until they were 8, therefore the effects of adding teplizumab are likely to be small.
We have assumed that a screening programme in the UK would achieve exactly the same outcomes as in Ziegler et al.8. A UK based programme may not have exactly the same outcomes as those in Germany. This means that our current model does not have a natural history component modelling of undiagnosed stage 1, stage 2, and stage 3 T1D in the general population. This implies that we cannot explore different tests for detecting T1D in our current modelling framework.
We have not conducted any primary research; as such, we do not include any utility decrements or increased rates of health care contacts related to psychological distress related to either a child presenting in DKA (to either the parent or the child), or psychological distress related to screening itself. These effects, if shown to exist, should be factored into any cost-effectiveness analysis of screening for type 1 diabetes.
There may be other economic benefits accrued from any health care program that are outside the NHS and personal social services perspective for economic evaluations set in England and Wales (e.g., preventing time off work for parents as their child is less likely to be present in DKA); however, what is not clear with these benefits is who should pay to gain these benefits (e.g., the parents themselves, their employers, or the government). There may be other economic benefits that are not included because of the absence of evidence. For example, we may be able to evaluate any changes in the psychological burden on the parent/caregiver and the patient.
Because we adopted a decision tree analysis, screening was performed in a snapshot. An actual screening program will have complexities (e.g., time from screening until diagnosis of T1D and testing schedule) that would require a type of model that explicitly includes time in the structure. This may cause changes in the cost and QALYs associated with screening. However, we expect these to be relatively small changes, and we would require extensive epidemiological studies on screening children for T1D in the UK, which currently does not exist.
Our estimates of the expected costs of treating children with T1D are likely to be overestimated. In the NICE appraisal of hybrid closed loops, evidence submitted to this appraisal was used as some of our key costing information for device and treatment costs for T1D, the committee’s preferred base case ICER was £104,003 per QALY gained and their acceptable ICER was £20,000 per QALY gained38. As hybrid closed loop is an approved technology in the UK, it is likely that there are commercially confidential arrangements between the device manufacturers and the UK government that effectively lowers the price of HCL from the publicly available prices we used when estimating the discounted lifetime cost of having T1D.
The key area for future research is to establish whether preventing DKA at diagnosis leads to long-term benefits in children with T1D. This is because it is unlikely that we could design a screening program that costs only an average of £3 per child screened. If these benefits exist, we have a much better chance of designing a screening program that can cost more than £20 per child screened, and if these benefits can be reasonably assumed to be permanent, then the cost per child screened could rise to over £50 per child screened.
Our model was moderately sensitive to increasing the number of deaths due to DKA at diagnosis (the cost of screening increased from £3.17 to £7.28), so obtaining better information on this model parameter would be useful.
It would be useful to develop an economic model of T1D that appropriately includes the incidence of diabetes-related complications during childhood. Our approach in this project of not allowing diabetes-related complications was simple and may have been inaccurate. However, this gap will likely require the development of new epidemiological risk equations for diabetes-related complications in T1D children.
If teplizumab or other agents are approved to delay T1D in children, the available information should be included in this analysis. However, if these are completely new products to the UK market, it is likely that they will be priced to capture the benefits obtained by using the treatments. This impact is likely to be small in terms of the cost-effectiveness of screening T1D. However, they could be essential for designing a screening program for T1D, as they would give children who test positive for treatment. This would likely increase the acceptability of screening for T1D among parents.
There have been two previous analyses of T1D screening in children. There was an analysis by Karl et al. that conducted an analysis of the costs of screening in the Fr1da study by statistically analysing cost data collected in FRIDA and from routine sources in Germany39. This was a within study costing of the Fr1da data and they found that screening for T1D as implemented in Fr1da cost €28.17 per child screened. There will be some differences between the German and English/Welsh settings of the Fr1da study and our analysis; however, if we can establish that there are some long-term benefits of screening, then it may be cost-effective to screen young children (four years old) for T1D. There was an analysis by McQueen et al. In the US setting, McQueen et al. found that avoiding DKA events alone would not result in cost-effective in the US setting. The model they used was an initial state transition up to age 30, which only tracked if children developed T1D and if they died, and a lifetime simulation model after age 30 to track the incidence of complications associated with T1D over children’s lifetimes. This is similar to our result, albeit with the US having a higher maximum acceptable ICER generally than England and Wales, they found that screening could be cost-effective with only an HbA1c improvement of 0.1% over a lifetime40. This again, is similar to our results. A recent review by Rewers, found similar results in that DKA prevention alone would not be sufficient to make screening for T1D worthwhile41. However, Rewers also made a point that societal costs, such as productivity and quality of life of the parents when their child is diagnosed would be additional economic benefits to those gained directly by the children with T1D with regards to their health41.
If screening for T1D can only prevent DKA at diagnosis, it would be very difficult to design a screening program that could be economically viable, as we would need it to cost £3 per child screened. If other benefits can be associated with screening, in particular, forming part of a relatively low-cost program to delay the onset of T1D, then this cost rises and designing a cost-effective screening program becomes more likely. Conducting further research to establish whether preventing DKA at diagnosis has long-term benefits for children with T1D is also a key area for future research.
Provide sufficient details of any financial or non-financial competing interests to enable users to assess whether your comments might lead a reasonable person to question your impartiality. Consider the following examples, but note that this is not an exhaustive list:
Sign up for content alerts and receive a weekly or monthly email with all newly published articles
Register with NIHR Open Research
Already registered? Sign in
If you are a previous or current NIHR award holder, sign up for information about developments, publishing and publications from NIHR Open Research.
We'll keep you updated on any major new updates to NIHR Open Research
The email address should be the one you originally registered with F1000.
You registered with F1000 via Google, so we cannot reset your password.
To sign in, please click here.
If you still need help with your Google account password, please click here.
You registered with F1000 via Facebook, so we cannot reset your password.
To sign in, please click here.
If you still need help with your Facebook account password, please click here.
If your email address is registered with us, we will email you instructions to reset your password.
If you think you should have received this email but it has not arrived, please check your spam filters and/or contact for further assistance.
Comments on this article Comments (0)