Keywords
air pollution, air quality, neighbourhood, locality, systematic review.

air pollution, air quality, neighbourhood, locality, systematic review.
Outdoor air pollution is a serious public health concern, with an estimated annual mortality burden of between 28,000 and 36,000 deaths in the UK.1 Effects on health include exacerbation of asthma, reduced lung function, and respiratory and cardiovascular events requiring hospital admission.1 Key sources of outdoor air pollution are particulate matter (PM), nitrogen dioxide (NO2), sulphur dioxide (SO2), ammonia (NH3), ozone (O3), carbon monoxide (CO) and non-methane volatile organic compounds (NMVOCs).2 Air pollution exacerbates health inequalities that already exist within local populations, in terms of who is more likely to be exposed, who is vulnerable to the effects of air pollution and who will have the most severe health consequences as a result of exposure. Groups that are disproportionately affected include older people, children, those with existing cardiovascular or respiratory disease, pregnant women, communities in areas of higher pollution, and low-income communities.1
In 2017, the National Institute for Health and Care Excellence (NICE) produced a guideline on outdoor air pollution based on systematic reviews of available evidence and expert consultation.3 This NICE guidance included recommendations on planning, development management, clean air zones (CAZs), reducing emissions from public sector transport services and vehicle fleets, smooth driving and speed reduction, walking and cycling, and awareness raising.4 At a similar time, in 2018, Public Health England (PHE), now the UK Health Security Agency (UKHSA), produced guidance on air pollution,2 which included recommendations for:
• Local government (focused on embedding consideration of air quality into programmes and plans, evaluating air pollution reduction interventions, investing in public transport and infrastructure, promoting walking and cycling, reducing traffic air pollution, consideration of air quality impact in urban planning design);
• The health service and healthcare professionals (focused on helping patients to consider air pollution in managing their conditions, reducing air pollution within the National Health Service (NHS) and encouraging active travel, and influencing and working with other decision-makers and professionals to reduce their impact on people’s exposure to air pollution);
• The public (focused on encouraging active travel, changing driving style, using public transport, judicious use of heating in the home, and considering air pollution when purchasing vehicles and appliances).
Further initiatives have been implemented and tested following the PHE/UKHSA recommendations, and there is a need to explore the effectiveness and acceptability of these of these. We therefore synthesised research evidence examining the effectiveness and acceptability of a comprehensive range of neighbourhood-level interventions to reduce outdoor air pollution, to aid local authority policy and decision-making.
We undertook a systematic review, employing elements of rapid review methodology in recognition that the review was time-constrained. These elements involved1: a single screening by one reviewer of titles and abstracts, with a 10% sample checked by another reviewer; and2 a single data extraction and quality assessment, with a 60% sample checked by another reviewer).5–7 The protocol is registered on the PROSPERO registry, registration number CRD42023442564.
A patient and public involvement (PPI) group was convened to consult with at the start of the review, following the initial scoping and development of a conceptual framework, and again towards the end, to discuss preliminary findings and dissemination. We also consulted with key stakeholders (people with topic expertise and/or a vested interest in the review findings, including academics from diverse fields, and people working in local authorities, the UK Health Security Agency (UKHSA) and Office for Health Improvement and Disparities (OHID)) at these timepoints. PPI members were recruited from a wider PPI group for the Sheffield Public Health Review Team, and included a mixture of people living in urban, rural and coastal settings, from different parts of the UK, including people with experience of neighbourhood interventions to address outdoor air pollution. PPI members and stakeholders were not involved with the design of the review or the scope, as the review was commissioned by the NIHR, for the Public Health Review Team. PPI members highlighted benefits and concerns from their experiences of interventions, which the review team ensured were considered when extracting data, particularly relating to the acceptability of interventions, for instance, considerations of safety and spillover relating to low traffic neighbourhoods. Stakeholders similarly raised issues for consideration, for instance, the addition of shipping and construction to the a priori conceptual framework as sources of pollution to consider and highlighted potential issues with the measurement of air pollution. Both groups provided terms relating to types of neighbourhood interventions, which we used when searching for evidence.
Initial scoping searches were conducted using relevant terms based on initial stakeholder consultation undertaken with stakeholders Derbyshire County Council (who proposed the topic), scrutiny of previous related reviews and guidance,1,4 and practitioner expertise within the team (SH). Relevant papers identified through this process were used to identify further search terms on which to base the database search.
Prior to conducting the review, we sought to identify an appropriate conceptual framework or logic model to guide the review and data synthesis process. We identified several relevant theoretical frameworks in the public health literature, through public health expertise within the team (SH), consultation with stakeholders, relevant papers identified through initial scoping searches, and specific preliminary searches to identify theoretical frameworks related to air pollution interventions using Google Scholar. These include the Diderichsen model,8 the Driving force-Pressure-State-Exposure-Effect-Action (DPSEEA) framework,9 the air pollution hierarchy1 and a conceptual framework relating to one particular neighbourhood intervention (Barcelona Superblocks)10 identified during scoping work. We then developed an initial conceptual framework for the impact of neighbourhood-level interventions to reduce air pollution based on these relevant theoretical frameworks, combined with information provided by stakeholders. We further refined this conceptual framework in consultation with key policy and practice stakeholders and topic experts (see Figure 1). We then used this conceptual framework to guide data synthesis.
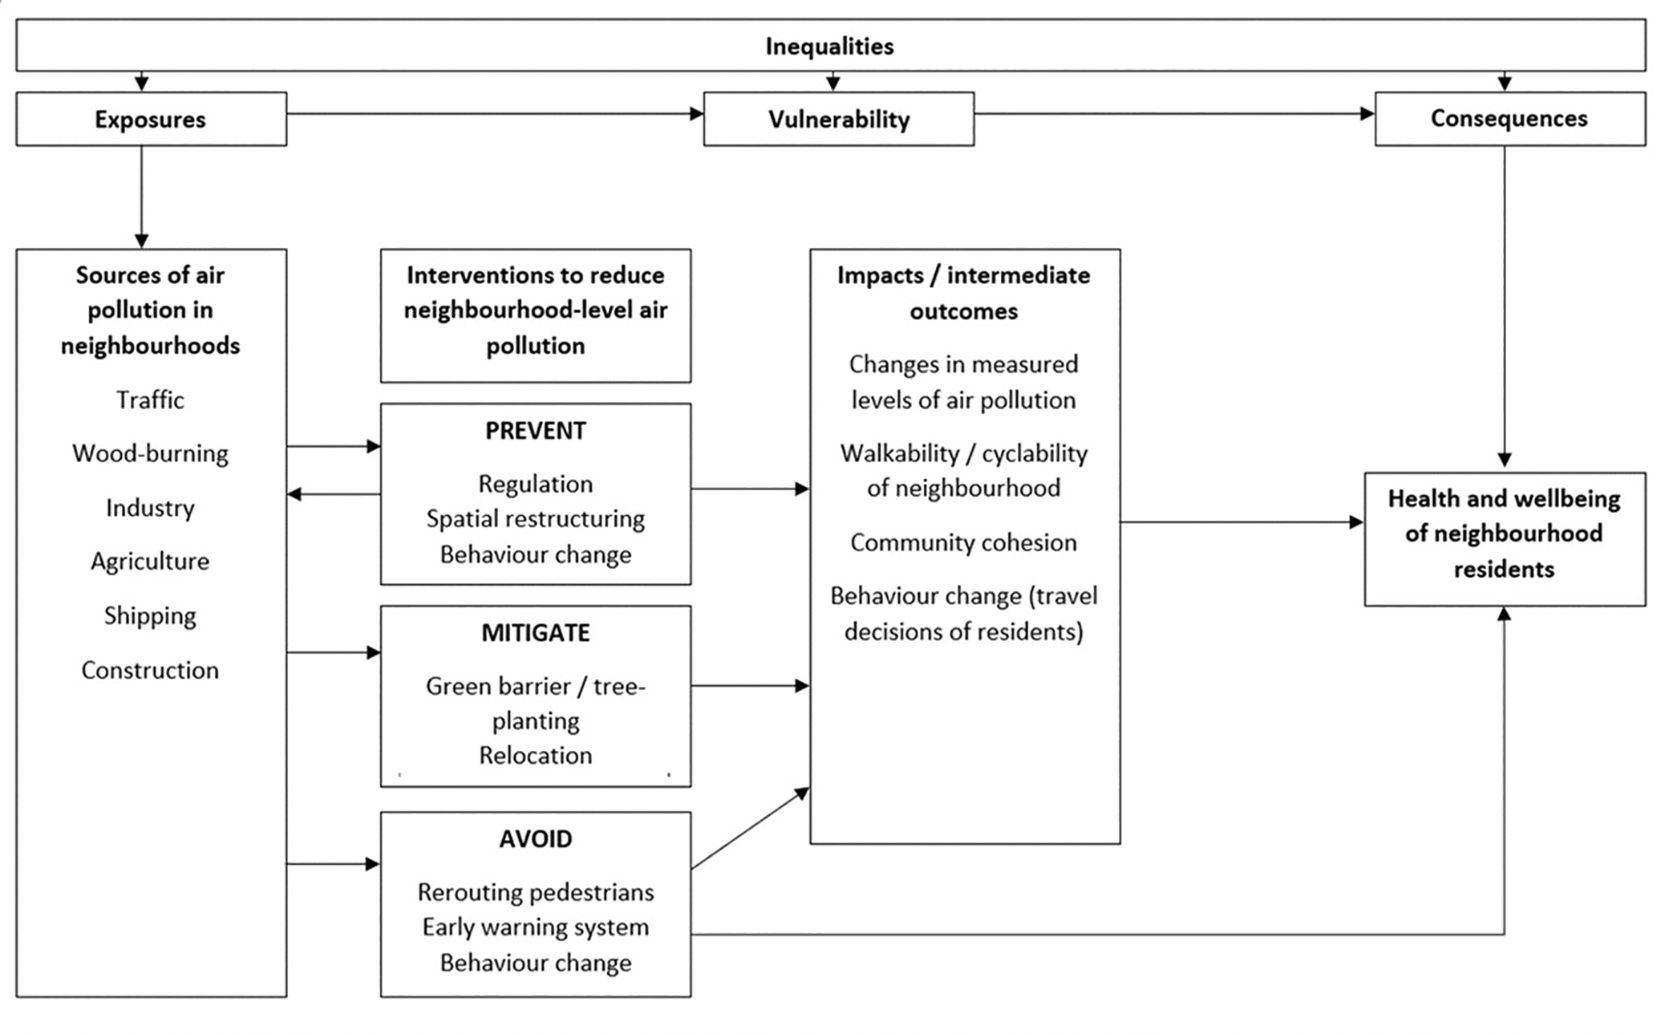
The a priori conceptual framework that guided our review, developed from a combination of the Diderichsen model,8 the Driving force-Pressure-State-Exposure-Effect-Action (DPSEEA) framework,9 the air pollution hierarchy1 and a conceptual framework relating to one particular neighbourhood intervention (Barcelona Superblocks10) identified during scoping work, and refined through consultation with stakeholders.
Following initial scoping to familiarise the review team with the literature, comprehensive searches were conducted in July 2023 to identify relevant evidence from the following databases: MEDLINE, EMBASE and Econlit (via Ovid); GreenFILE (via EBSCO); Science Citation Index and Social Science Citation Index (via Web of Science) and the Cochrane Library (via Wiley).
Searches included generic terms for air improvement initiatives as well as the names of specific interventions known to the team. Searches were restricted to papers in the English language published since 2015. Results likely to be from the UK (identified via filters and database limits) were flagged for prioritised screening. Search strings are available from https://doi.org/10.15131/shef.data.31493953.
To limit the risk of missing relevant material, we additionally used citationchaser (https://estech.shinyapps.io/citationchaser/) to identify references and citing articles for included studies.
Following the advice of stakeholders, we searched for unpublished/“grey” literature on the websites of organisations including the following: DEFRA (Department for Environment, Food and Rural Affairs UK); UKHSA (formerly part of PHE); The Environment Agency; Imperial College NExAir; Mums For Lungs; Idling Action; SusTrans; the Local Government Association (LGA) and the Air Quality Hub. We also conducted targeted searching of the.gov.uk domain for the name of specific initiatives such as “school streets”, “low traffic neighbourhoods” and “clean air zones”.
We included quantitative, qualitative and observational studies that examined the effectiveness and/or acceptability of neighbourhood-level interventions aimed at reducing human exposure to and health impacts of outdoor air pollution, compared with one or more control neighbourhood/s (where there is no intervention taking place), or the same neighbourhood prior to the introduction of the intervention, on health and wellbeing outcomes or intermediate outcomes. Intermediate outcomes included exposures known to be precursors of health and wellbeing, primarily air quality, or proxy outcomes, such as traffic level. Impacts of interventions on surrounding neighbourhoods were examined where reported (to examine any displacement impact – e.g., of a traffic-based intervention). For qualitative research, people’s experiences of how neighbourhood-level interventions address outdoor air pollution and related concepts (e.g., walkability, physical activity, community cohesion) were the phenomena of interest, along with the acceptability of the intervention. We included studies published since 2015, which is the search date of the reviews to inform the NICE guideline on local interventions to reduce outdoor air pollution, and published in English.
Evidence relating to national-level, regional-level, city-level and individual-level interventions to address outdoor air pollution were excluded, as was evidence examining interventions to address indoor air pollution (if the initiative did not also address outdoor air pollution). Systematic reviews were excluded to avoid double-counting evidence, but their reference lists were scrutinised for relevant studies. Books and dissertations were also excluded.
Search results from electronic databases were downloaded to a reference management application (EndNote) and de-duplicated, then imported into Rayyan for screening. One reviewer screened titles and abstracts against inclusion criteria, and a second reviewer screened a 10% sample. Full texts of articles included at abstract screening were examined by one reviewer and checked by another. Any disagreements were resolved through discussion, and a third reviewer was involved where uncertainties remained.
Grey literature sources were compiled in a spreadsheet and examined at full text by one reviewer. Further grey literature sources suggested by stakeholders and topic experts were screened at full text.
One reviewer screened reference lists of included studies and reviews for potentially relevant papers, downloading any potentially relevant full texts. Full texts of grey literature sources (e.g., reports, web pages) were screened by one reviewer and checked by another, with consensus achieved through discussion where disagreement arose.
We devised a data extraction form based on forms previously used by our team for similar reviews of public health topics. Three reviewers piloted the extraction form and agreed on suggested revisions before commencing further extraction. Three reviewers extracted and tabulated key data from the included papers and grey literature sources, with one reviewer completing data extraction of each study and a second reviewer checking each extraction for accuracy and consistency. The following data items were extracted: author and year, location, study design and analysis, population (where relevant), setting, source of air pollution, intervention type, whether the intervention was intended to prevent, mitigate or avoid air pollution (from the a priori conceptual framework), intervention details, motivation for intervention, outcome measures and duration of follow-up, and limitations. For quantitative results, information on results relating to air quality, health and wellbeing, community cohesion, active travel, spillover, and inequalities inherent in results and/or methods were extracted. For qualitative findings, key themes and subthemes, author interpretations, quotations, and inequalities inherent in results and/or methods were extracted.
Before and after studies (with independent samples) were appraised using the scale for risk of bias for interrupted time series studies in the Cochrane Handbook,11 cross-sectional comparison studies were appraised using the Joanna Briggs Institute scale for quasi-experimental studies,12 and qualitative studies were appraised using the Critical Appraisal Skills Programme (CASP) checklist for qualitative studies.13 Grey literature sources were additionally appraised using the Authority, Accuracy, Coverage, Objectivity, Date, Significance (AACODS) checklist,14 which extends beyond the assessment of study design, due to concerns about the lack of peer review. Quality assessment was performed by one reviewer and checked by another.
We synthesised data according to the a priori conceptual framework and sought additional nuance and detail inductively from the data, in an approach consistent with the second stage of ‘best fit framework synthesis’.15,16 We synthesised quantitative findings narratively, due to considerable heterogeneity in the measurement and reporting of outcomes, and types of outcomes reported, which precluded meta-analysis. There was insufficient qualitative data to conduct thematic synthesis, so we synthesised qualitative findings descriptively. We examined the influence of interventions on inequalities where reported. Evidence was synthesised by type of intervention, within the ‘prevent, mitigate, avoid’ element of the a priori conceptual framework.
Database searches generated 8912 records after removal of duplicates, of which 8803 records were excluded following title and abstract screening, and 109 were excluded on examination of full texts. Reviewers identified 103 reports/websites through grey literature searches and via stakeholders, subsequently excluding 89 full texts. Citation searches generated 429 records, of which 30 full texts were screened. Overall, 24 studies (reported in 26 papers/reports) were included in the review.17–42 Figure 2 summarises the process of study selection and Table 1 presents a summary of study characteristics. Studies excluded at full text screening and reasons for exclusion are available from https://doi.org/10.15131/shef.data.31493953. Of the included studies, the majority (17 studies) were conducted in the UK (13 in London, and one each in Edinburgh, Oxford, Southampton and Exeter), two studies were conducted in each of Australia and Spain, and one in each of Italy, Canada and the USA. Most studies reported interventions that aimed to address traffic pollution, with only one study focusing on industry as a source of air pollution. Nine studies reported on school streets interventions, seven on low traffic neighbourhoods, one on street adaptations, one on traffic calming outside school, two on anti-idling interventions, one on a walking school bus, three on a green wall and one on an early warning system. Ten studies examined the impact on air quality, nine measured traffic volume, and eight assessed behaviour change outcomes.
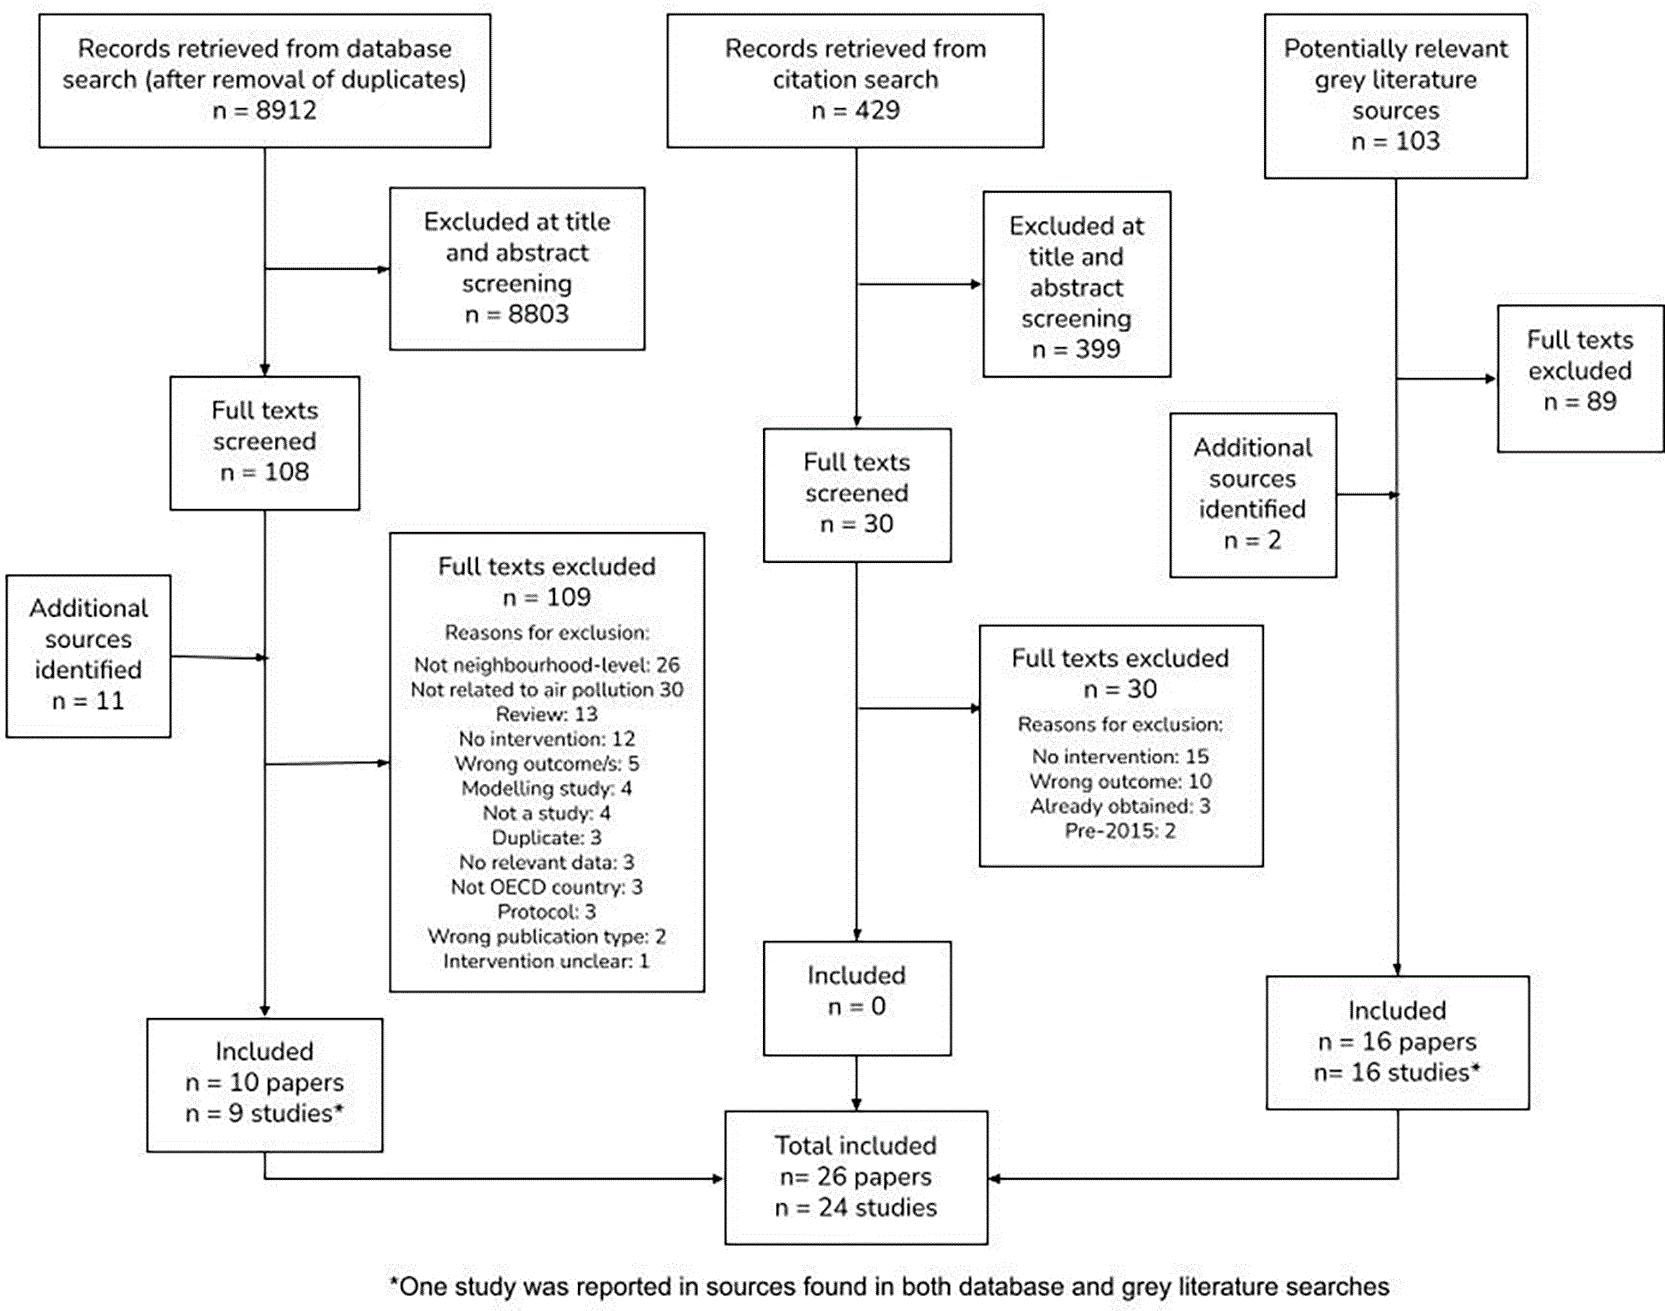
PRISMA flow diagram of the stages of study selection, for each search (database search, citation search, grey literature search).
| Study | Location | Setting | Study design & analysis | Source of air pollution | Intervention classification & type | Intervention summary | Outcome measures |
|---|---|---|---|---|---|---|---|
| Thomas 2022,17 Hackney Council 202118 | Hackney, London, UK | School neighbourhoods | Before and after study (independent) | Traffic | PREVENT: Regulation
School streets | Temporary closure of streets in front of schools to motor vehicle traffic at the beginning and end of the school day. | Automatic sensors (Vivacity) count pedestrians, vehicles, and cyclists. ‘After’ measurement period started immediately after the school street launch, for at least two weeks. NOx measured by diffusion tubes. |
| City of Edinburgh Council 201619 | Edinburgh, UK | School neighbourhoods (urban/suburban) | Before and after study (independent) | Traffic | PREVENT: Regulation
School streets | Road closures outside schools implemented using an Experimental Traffic Regulation Order to legally restrict motor vehicles during school-specific periods, with signs and flashing lights, and exemptions for emergency and utility vehicles. | Traffic volume assessed using pneumatic tubes for a 14-day period at baseline and 6 months, during closure periods (0700–1000 and 1300–1600 Mon-Thurs, and 0700–1000 and 1100–1300 Fri). Perceptions assessed using before and after surveys. |
| Below 202220 | Southampton, UK | School neighbourhood (suburban, one school) | Before and after study (independent) | Traffic | PREVENT: Regulation
School streets | The road outside the school was closed to road traffic during the morning and afternoon school drop-off/pick-up times (0815–0915 and 1430–1530). Street adaptations were also made to enhance road safety (a colourful thermoplastic crossing installation; pencil bollards; a paper clip-shaped bike stand; an interactive trumpet noise stand). Implemented during pandemic. | Traffic speed and volume was assessed using a pneumatic tube device before (2 years prior to implementation) and 6 weeks post-implementation. |
| Abjith 202221 | London Borough of Lambeth, London, UK | One primary school located in a residential area | Before and after study | Traffic | PREVENT: Regulation
School streets | The street outside the school was closed to road traffic between 13:00 and 17:00 (to cover school pick-up time). Conducted during pandemic (fewer restrictions during follow-up). | Outdoor air quality (PM10, PM2.5, PM1, CO2) monitoring conducted near main gate at a sampling height of 1.7 m, using Electrical Low-Pressure
Impactor, particle logger, and HOBO MX1102 CO2 logger, before and immediately after implementation. |
| Newham Council 202422 | London Borough of Newham, London, UK | School neighbourhoods (urban/suburban) | Before and after study. | Traffic | PREVENT: Regulation
School streets | ‘Newham Healthy School Streets’ – timed restriction to motorised traffic on roads outside and surrounding a school, during school pick-up and drop-off times. Enforced by Automatic Number Plate Recognition (ANPR) cameras. Some sites use bollards, fences or volunteer stewards. | NO2 measurement at key entrances, comparing before and after implementation, no details on measurement or follow-up period. Active travel assessed using the Transport For London STARs Hands Up Survey. |
| 8 80 Cities 202023 | Toronto, Canada | School neighbourhood (one school) | Before and after study | Traffic | PREVENT: Regulation
School streets | ‘8 80 Streets Mountview’, a school streets pop-up. Temporary (4 days) car-free environment outside the school at drop-off and pick-up times. Community volunteers set up barriers at entrances to the street and acted as marshals. Posters, announcements and classroom visits were used to promote the initiative. | Mode of travel to school (via self-reporting using classroom polls, the week before the school street (baseline) and during the school street). |
| Air Quality Consultants Ltd. 202124 | London Boroughs of Brent, Enfield and Lambeth, London, UK | School neighbourhoods (urban/suburban) | Post-intervention data, partially comparative. Time series analysis based on average diurnal profiles. | Traffic | PREVENT: Regulation
School streets | Roads outside the chosen schools (n = 16 schools) were closed at drop-off and pick-up times during the school term (and not over half-term). Actual road closure was not monitored. | NO and NO2 monitored via 30 AQMesh sensors (n = 30 monitoring locations), during implementation of the school street in the autumn term (mainly September and October 2020, although one was installed in November 2020, until 20th December 2020). No baseline data was collected. |
| Bicycle Network and Merri-bek City Council 202225 | Merri-Bek, Melbourne, Victoria, Australia | 3 school sites, in a diverse (in terms of culture, language, socio-economic background, built environment and access to transport), urban/suburban | Before and after study | Traffic | PREVENT: Regulation
School streets | Temporary road closure on one or more roads surrounding a school for a short period at the start and end of the school day, over a designated number of days across three weeks. These areas are opened up to people using bikes, scooters, and on foot, with drop off zones for people that need to use cars resettled in nearby locations. Undertaken across 2021 and 2022. | Change in active travel (walking and cycling) from baseline, (self reported), parent and resident perceptions of behaviour change (pre/during/post-intervention), change in traffic levels (through observation/counting, on 5 days per school, versus a control day in the week prior and post). Follow-up measurements were undertaken on three consecutive weeks after implementation. |
| Xiao 2022,26 Xiao 2023,27 Southwark Council 202328 | London Borough of Southwark, London, UK | Urban/suburban neighbourhoods | Controlled before and after study (natural experiment) | Traffic | PREVENT: Spatial restructuring
Low traffic neighbourhoods | Modal filtering in six neighbourhoods in Southwark (Brunswick Park, North Peckham, East Faraday, Dulwich Village, East Dulwich, Champion Hill) using planters and bollards that restricted access to motorised traffic but not to pedestrians and cyclists. Small-scale streetscape changes were also made, to enhance the environment for pedestrians and cyclists (narrowing carriageways, widening footways, adding drop kerbs at crossing points, adding seating and planting). | Traffic counts (using automatic counters and video monitors), undertaken before (September 2019) and at least 1 year after implementation (September 2021). Percentage reduction was calculated (against the context of an overall 7% reduction in traffic levels across Southwark in September 2021 compared with September 2019). |
| Hammersmith and Fulham Council 202429 | London Borough of Hammersmith and Fulham, London, UK | Urban neighbourhoods | Before and after study | Traffic | PREVENT: Spatial restructuring
Low traffic neighbourhoods | Two Clean Air Neighbourhoods - South Fulham (west; reported on) and South Fulham (east; no data reported). Five automatic number plate recognition cameras were installed. Urban design features to discourage motorised transport and encourage active travel were planned but not yet implemented at the time of reporting. | Traffic counting monitors - no details. Measured pre-trial (March 2022) and a year later (March 2023, during the trial). |
| Stanley 202230 | Cowley, Oxfordshire, UK | Suburban neighbourhoods | Comparative before and after study. | Traffic | PREVENT: Spatial restructuring
Low traffic neighbourhoods | Three LTNs within the Cowley area (Church Cowley, Temple Cowley, and Florence Park). Traffic filters at specific points, using planters or bollards. Implementation began on 1st March 2021 and installation was complete on 17th May 2021. | Air quality, assessed using diffusion tubes (measuring ambient NO2) managed by Oxford City Council, as part of the existing air quality network. Baseline in 2017–2019, post-LTN measurements in 2021. All sites were on boundary roads. Traffic counts, undertaken using Vivacity Lab Sensors. Measurements taken in 2019 (February to November - baseline) and 2021 (follow-up). |
| London Borough of Waltham Forest 202231 | London Borough of Waltham Forest, London, UK | Suburban neighbourhoods | Before and after study | Traffic | PREVENT: Spatial restructuring
Low traffic neighbourhoods | Trial of the first LTN in the UK using a ‘mini-Holland’ template. The LTN included road closures and street improvements to encourage walking and cycling. Took place in 2014. Trial road closures took place between 26th September 2014 and 13th October 2014. | Traffic counts, assessed using traffic monitoring systems. Follow-up took place during the trial and in July 2016. |
| Yang 202232 | London Borough of Islington, London, UK | Dense urban neighbourhoods | Controlled before and after study (natural experiment). | Traffic | PREVENT: Spatial restructuring
Low traffic neighbourhoods | Three LTNs evaluated - Canonbury East, Clerkenwell, and St. Peter’s). Use of modal filters to restrict traffic. Few details reported. | Air quality: Monthly NO2 (μg/m3) concentrations measured by passive diffusion tubes - 93 sites, January 2018 to February 2021. Data were analysed from July 2019, with data available for 4 or 5 months post-LTN. Monitoring sites were classified as background (located away from major pollution sources) or roadside (located <=5 m of a busy road’s kerb) according to DEFRA (2021) guidance. Traffic volume: Automatic traffic counters, installed for one week during the month prior to the LTN installation and one week approximately 6 months after LTN installation. Comparison data was obtained from 13 other TfL count sites in Islington. Traffic count sites were classified as major (located on A roads) or minor (otherwise). |
| Tower Hamlets 202333 | London Borough of Tower Hamlets, London, UK | Urban/suburban neighbourhoods | Before and after study | Traffic | PREVENT: Spatial restructuring
Low traffic neighbourhoods | Road closures, directional changes to traffic and ‘public realm enhancements’ (e.g., a ‘pocket park’, public realm enhancements involving closing roads to traffic). | Air quality: Diffusion tubes to monitor NO2 (ongoing by council). Assessed in 2019 and 2022. Traffic volume: Traffic counts on closure streets and neighbouring streets. No details on measurement given. Traffic volume on boundary roads was assessed using data from TRL Astrid Database monitoring involving detectors on traffic signals. Data from the PM peak (1600–1900) were examined for three locations1: Hackney Road/Queensbridge Road2; Hackney Road/Cambridge Heath Road3; Bethnal Green Road and Vallance Road |
| Perez 202134 | Barcelona, Spain | Urban (dense) | Pre-post quantitative study with qualitative evaluation (across multiple locations) | Traffic | PREVENT: Spatial restructuring
Low traffic neighbourhoods | Superblocks – a grid of basic roads forming a polygon, the interior of which is closed to motorised vehicles. | Air quality (NO2, PM, PAHs, benzene, black carbon); Physical activity; Neighbourhood walkability; Health (surveys - general health and wellbeing, mental health, sleep quality); Social cohesion; Satisfaction with the neighbourhood; Use of public spaces; Traffic injuries; Opinions/views (ethnography and focus groups). Assessed pre- and post-intervention (no detail on timepoints reported). |
| Crane 201635 | Redfern and Waterloo suburbs in Sydney, Australia | Suburban, main street with shops and businesses | Mixed methods before and after study | Traffic | PREVENT: Spatial restructuring
Street adaptations | Construction of a bi-directional cycle path, separated from traffic and pedestrian space, made by repurposing vehicle traffic space, complemented by reducing the speed limit and improving pedestrian footpaths. | Perceived and actual impact - quality of life, health, physical activity and neighbourhood/community cohesion. Follow-up: soon after the construction of the cycleway and again a year later. |
| Perez-Martin 201836 | Cordoba, Spain | School and surrounding neighbourhood | Before and after study | Traffic | PREVENT: Behaviour change
Walking school bus | Walking school bus intervention | Modal shift from car use to walking |
| Mendoza 202237 | Salt Lake County, Utah, USA | School and surrounding neighbourhood | Before and after study | Traffic | PREVENT: Behaviour change
Anti-idling | Anti-idling campaigns outside two elementary (primary) schools, at the drop-off zones. | Research-grade air quality sensors mounted to a van, parked outside the school. Idling - vehicle counts and idling duration. Measures taken before and after the study. |
| Behavioural Insights Team 202238 | London Borough of Merton, London, UK | The road leading up to a level crossing | Before and after study | Traffic | PREVENT: Behaviour change
Anti-idling | Sign visible by drivers queueing up to the level crossing when the barriers are down, which says “SAVE MONEY, SAVE FUEL, TURN OFF YOUR ENGINE”. | Vehicle observation of idling (by human observers making counts of idling vehicles). 11.5 hours of observations conducted over 5 days, by 3 observers. First 8 vehicles in the queue observed (able to see the sign). Assessed before and after placement of the sign (1 month apart). |
| Below 202220 | Exeter, Devon, UK | Suburban, school | Before and after study | Traffic | PREVENT: Behaviour change
Traffic calming outside school | An image of a ‘traffic calming dragon’ painted onto the carriageway outside the school, resulting from a participatory/collaborative process involving schoolchildren, parents, residents and stakeholders (the ‘school community’). | Traffic volume using a pneumatic tube device, assessed pre- (20th–26th May 2018) and post-intervention (10th–16th May 2021). Road users’ and residents’ views and perceptions of safety relating to the road change (November 2018 and May 2021). |
| Abjith 202221 | London Borough of Lambeth, London, UK | One primary school located in a residential area | Before and after study | Traffic | MITIGATE: Green barrier
Green wall | An ivy (Hedera helix) green screen was installed along the school fence (next to the main road), installed immediately after pre-intervention monitoring. Grown on a steel frame to a height of 2.2 m and a length of 73.2 m. | Outdoor air quality (PM10, PM2.5, PM1, CO2) monitoring conducted near main gate (between the school fence and the green screen) at a sampling height of 1.7 m, using Electrical Low-Pressure Impactor, particle logger, and HOBO MX1102 CO2 logger, before and after around 1 month after. |
| Tremper 201539 | Royal Borough of Kensington and Chelsea, London, UK | One primary school | Before and after study | Traffic | MITIGATE: Green barrier
Green wall | Ivy screen installed on the inside of the fence enclosing the playground. | NO2 and PM10 were assessed over a 1-year period using sensors on the roadside and playground side of the screen, with the first 3 months of the year considered ‘pre-growth’. |
| Tremper 201840 | London Borough of Enfield, London, UK | Primary school | Before and after study | Traffic | MITIGATE: Green barrier
Green wall | Ivy screen installed on the inside of the fence enclosing the playground. | NO2 was assessed periodically over a 3-year period using sensors on the roadside and playground side of the screen. |
| Giancolo 2021,41 Mangia 202042 | Taranto, Italy | Neighbourhoods close to a large steel plant | Interrupted time series with the use of a control series (control neighbourhood a bit further away from the plant but with similar environmental conditions). | Industrial | AVOID: Early warning system
Early warning system | Early warning system for the factory on ‘wind days’, when the wind was set to blow towards the neighbourhood at a particular speed. The factory then had to aim to reduce emissions by 10% for at least 3 consecutive hours. | Air quality (PM10 concentrations from monitoring stations in the intervention and control neighbourhoods, recorded 2009–2019). Also Polycyclic aromatic hydrocarbons (PAHs) and SO2. |
Quality assessment tables are available from https://doi.org/10.15131/shef.data.31493953. Overall, the quality of included studies was judged to be moderate to good.
The majority of included studies utilised a before-and-after study design and were evaluated using the Cochrane Handbook checklist for interrupted time series studies. Three studies were rated as having a low risk of bias (scoring low risk on most items and high risk on no items, with the exception of knowledge of the intervention being prevented, which was rated ‘not applicable’ due to the nature of the interventions), and 19 studies were at moderate risk of bias (scoring high risk on at least two items). The items where most studies scored low risk related to the shape of the intervention being pre-specified, the intervention being unlikely to affect data collection and selective outcome reporting. The items where most studies scored high or unclear risk on related to the intervention being independent of other changes (mainly changes in traffic levels due to COVID-19 lockdown and other citywide or regional initiatives that were operating at the same time, such as an ultra-low emission zone), and other risks of bias (these included traffic changes relating to the COVID-19 pandemic, seasonality, measurement and changes in fuel prices). In general, the process for accounting for incomplete outcome data was unclear. Reporting of methods often lacked important details necessary to judge the quality of the study, particularly among studies reported in grey literature.
One study35 was evaluated using the CASP checklist for qualitative studies. This study was considered moderate to good quality, being judged good quality on all items except for adequate consideration of the relationship between the researcher and participants, and taking ethical issues into consideration, which were not reported on.
All studies reported in grey literature were rated as being good quality using the AACODS checklist. None of the items (relating to authority, accuracy, coverage, objectivity, date and significance) were rated as being poor or unclear for any study.
The updated conceptual framework for the impact of neighbourhood-level interventions to reduce air pollution is presented in Figure 3. All parts of the ‘prevent, mitigate, avoid’ element were covered by the evidence included. Interventions examined included: school streets (prevent: regulation); low traffic neighbourhoods (prevent: spatial restructuring); street adaptations (prevent: spatial restructuring); walking school bus (prevent: behaviour change); anti-idling (prevent: behaviour change); traffic calming outside school (prevent: behaviour change); green wall (mitigate: green barrier); early warning system (avoid: early warning system). Studies reported on exposure-related outcomes, including air quality, traffic, behaviour change and perceptions/community impacts. No studies were identified that examined the effectiveness of neighbourhood-level interventions to reduce outdoor air pollution on health outcomes. Findings relating to the included studies are presented in Table 2.
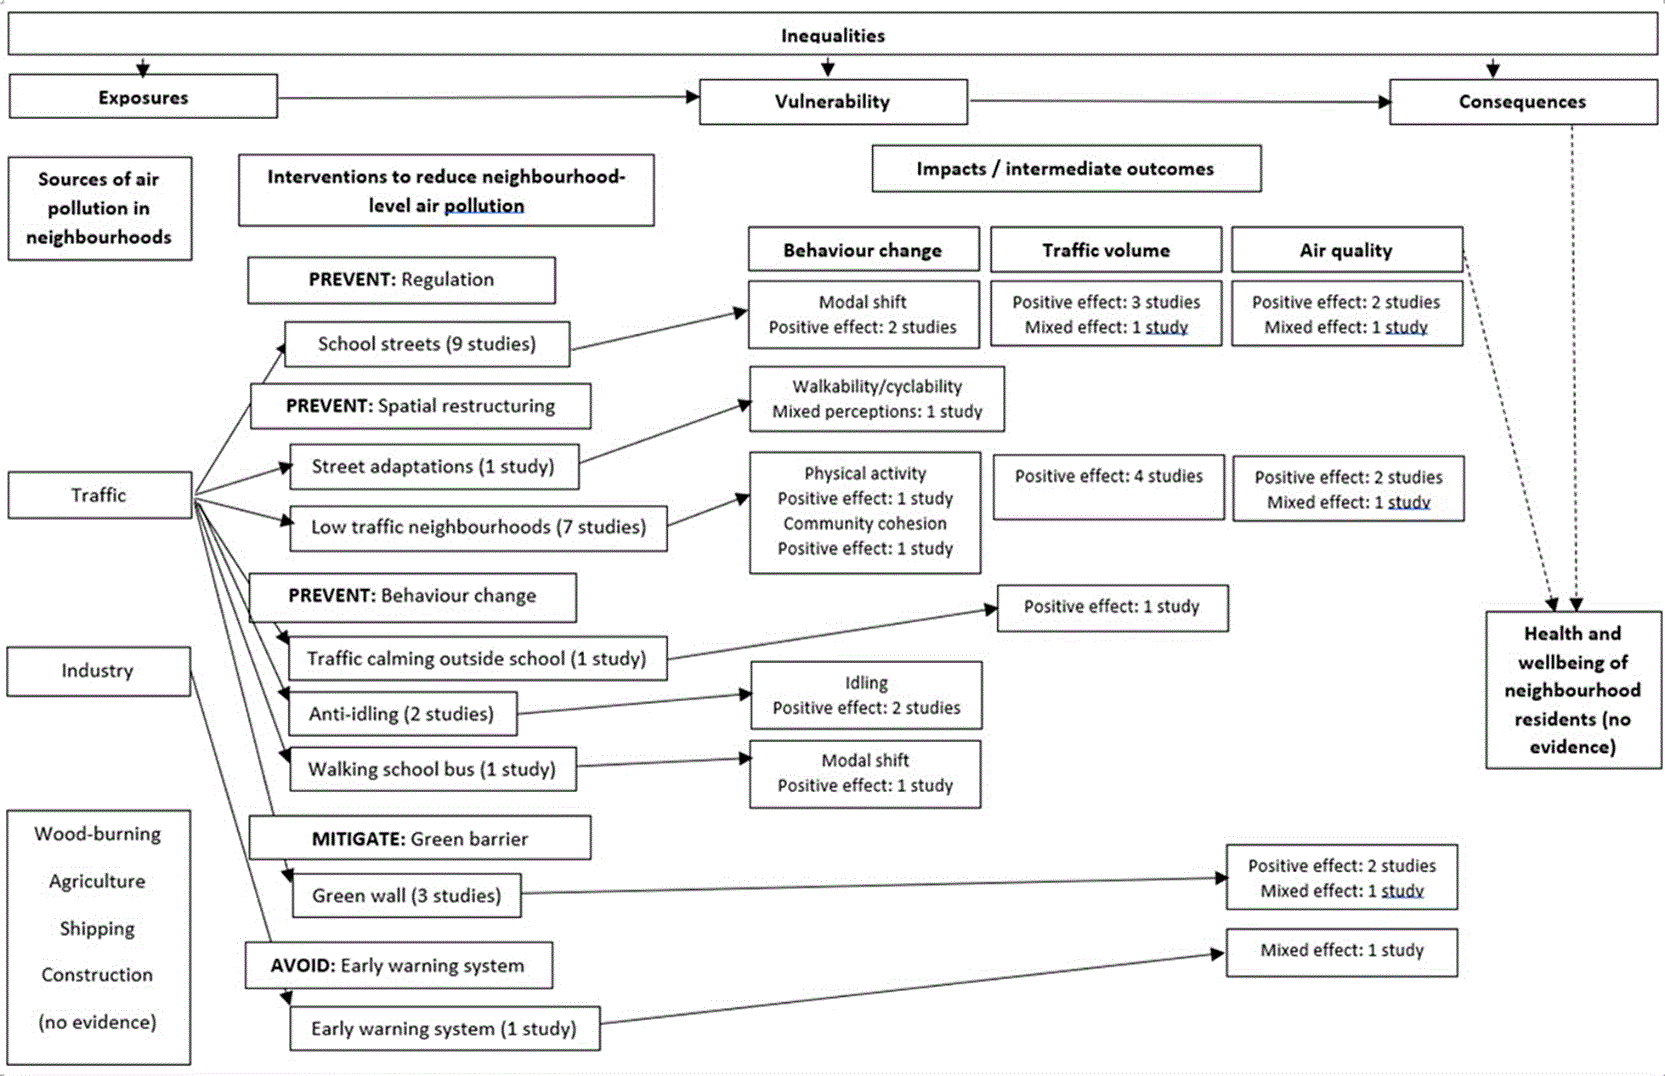
A depiction of how the review evidence fits into the a priori conceptual framework depicted in Figure 1.
| Study | Intervention type | Air quality | Traffic volume | Behaviour change | Spillover | Perceptions/community cohesion | Inequalities |
|---|---|---|---|---|---|---|---|
| PREVENT: Regulation | |||||||
| Thomas 2022,17 Hackney Council 202118 | School streets | When school streets were in operation, total NOx, PM10 and PM2.5 decreased by 74%. | 55% and 64% decline in traffic volume during closure times (compared with 16% and 11% increase outside of closure times) from baseline with mobile sensors. Fixed sensors measured a 75% decrease in traffic. | Minimal change in pedestrian numbers (slight decrease of 5% and 9%). Increased cycling at one site assessed by fixed sensors (40% over closure period, 16% over full 24 h period). | Slight increase in traffic on surrounding routes, but not equal to the decrease on streets within the closure zone, indicating evaporation rather than displacement. | NR | NR |
| City of Edinburgh Council 201619 | School streets | NR | Across all sites, vehicle numbers reduced by 2259 vehicles per day overall on all streets, and by 3179 on school streets. | Walking increased by 3% overall Cycling reduced by 1% overall Park and stride increased by 2% overall Proportion of kids driven to/from school reduced by 6%. | Across all sites, vehicle numbers increased by 920 vehicles per day on surrounding streets. This is less than the reductions on school streets (3179 vehicles per day), indicating a net reduction overall. | Perceptions of compliance increased from 43% to 54% (and disagreement levels decreased from 32% to 29%) among parents, and increased from 44% to 64% (and disagreement levels decreased from 17% to 12%) among school street residents. Among peripheral residents, agreement levels increased from 36% to 59% although disagreement levels increased from 20% to 25%. 74% of residents and 72% of parents anticipated improved safely of children travelling to/from school at baseline and this fell to 50% to 65% (respectively) in follow-up surveys. 66% of parents agreed (22% strongly agreed) that the streets with vehicle restrictions feel safer during operating times, whilst 16% disagreed (5% strongly disagreed). Among school street residents, 61% agreed (26% strongly), and 16% disagreed (5% strongly). Among residents on peripheral streets, 48% agreed (13% strongly) and 12% disagreed (8% strongly). | NR |
| Below 202220 | School streets | NR | Traffic volume decreased from 1782 to 1258 vehicles per day (29% decrease) on weekdays, and from 1303 to 1064 vehicles per day (18% decrease) on weekends. May be confounded by pandemic. | NR | NR | At baseline (n = 38), 4 respondents (11%) reported feeling very safe or somewhat safe when crossing the road outside the school, and 32 (84%) reported feeling somewhat or very unsafe. At follow-up (n = 19), 17 respondents (89%) reported feeling very safe or somewhat safe when crossing the road outside the school, and 2 (2%) reported feeling somewhat or very unsafe. | NR |
| Abjith 202221 | School streets | Levels of all three types of PM were lower after implementation. PM10 levels fell from 27 to 16 μgm−3 (36% reduction), PM2.5 levels fell from 15 to 11 μgm−3 (31% reduction) and PM1 levels fell from 13 to 9 μgm−3 (30% reduction). | Traffic volume fell from 47 to 31 vehicles per hour (33% reduction) | NR | NR | NR | All schools were in the London borough of Lambeth. |
| Newham Council 202422 | School streets | Average NO2 reductions of 31% and 20% in the morning and evening peak hour outside participating schools. | NR | Walking increased by an average of 10%. | NR | NR | The study was undertaken in East London, where the life expectancy is lower than in West London. |
| 8 80 Cities 202023 | School streets | NR | NR | 5.4% more students used active travel during the pop-up (from 269/372 to 296/388) and 20.5% fewer students used car travel (from 69/372 to 57/388). | NR | The number of people who felt safe on the road outside the school increased from 23% to 97% of people. “One parent who normally drove told us that the pop-up made him realize that the school was closer than he thought, within easy walking distance for him and his child”. “Other parents indicated that they would be more inclined to allow their children to walk to school independently if Mountview Avenue had a longer-term School Streets program”. “Great to have more space, and the air quality is so much better. Much less chaos” (Parent) | NR |
| Air Quality Consultants Ltd. 202124 | School streets | Overall mixed evidence for an impact on the school street on air quality. Seven (of 30) monitoring sites reported a dip in concentrations (especially NO) in the morning closure period but not in the afternoon and may be confounded by isolated spikes in concentrations beforehand, and seasonal and meterological factors. | NR | Attitudinal survey of parents suggested a 27% increase in walking, a 6% increase in cycling and a 2% increase in scooting due to the school street (distinct from changes due to the pandemic). Parents reported an 18% decrease in car transportation to school as a result of the school street. | NR | NR | NR |
| Bicycle Network and Merri-bek City Council 202225 | School streets | On closure streets, traffic volume was reduced by a total of 139, 121 and 208 vehicles at each school, respectively, in the morning, and by 107, 81, and 184 vehicles at each school, respectively, in the afternoon. Total reduction in vehicles was 468 and 372 in the morning and afternoon, respectively. | On surrounding streets, in the morning traffic volume increased by 15 and 32 vehicles at two schools, respectively, and reduced by 58 at the third school. In the afternoon, traffic volume increased by 178 vehicles at one school, exhibited no net change at another, and reduced by 36 vehicles at the third school in the afternoon. In total, traffic volume on surrounding streets reduced by 11 and 36 vehicles in the morning and afternoon, respectively. | “Parents and teachers reported increased sense of community from meeting and chatting with other community members in the morning.” (p.16). No further details were reported. | The study sampled schools in diverse areas of Melbourne (in terms of culture, language, socio-economic background, built environment and access to transport), although how this related to the study findings has not been reported. | ||
| PREVENT: Spatial restructuring | |||||||
| Xiao 2022,26 Xiao 2023,27 Southwark Council 202328 | Low traffic neighbourhoods | NR | Decrease in traffic counts per day on LTN streets relative to controls: Brunswick Park: 860 counts (95% CI 409, 1312) North Peckham: 937 counts (95% CI 328, 1546) East Faraday: 291 counts (95% CI -2101, 2683; non-significant, with wide CI) All motor traffic count change (month) and % change (in the context of overall traffic levels being − 7% during the pandemic) on scheme area roads: Dulwich Village: −15009 (−34%) East Dulwich: −3639 (−88%) Champion Hill: −108 (−5%) | Increase of 202 (95% CI 48, 356) children observed walking daily in East Faraday, and a reduction in adult cyclists in North Peckham of about 31 daily (95% CI 10, 52). Cycle traffic count (month) and % change on LTN roads: Dulwich Village: +2230 (+78%) East Dulwich: +72 (+35%) Champion Hill: +42 (+12%) Cycle traffic count (month) and % change on external roads: Dulwich Village: +796 (+60%) East Dulwich: +424 (+38%) Champion Hill: +150 (+69%) Overall increase in cycling across all roads and areas in Dulwich Village, East Dulwich and Champion Hill: +61% | Brunswick Park, North Peckham and East Faraday: Traffic significantly increased on boundary roads in 1/3 areas on weekdays only (Brunswick Park), by 1548 vehicles on weekdays (95% CI 571, 2526), or by 17% (IRR 1.17, 95% CI 1.01, 1.35) and by 342 vehicles during peak hours (95% CI 30, 654). Dulwich Village, East Dulwich and Champion Hill: All motor traffic count change (month) and % change (in the context of overall traffic levels being −7% during the pandemic) on external roads: Dulwich Village: −2132 (−3%) East Dulwich: +360 (−1%) Champion Hill: −576 (−5%) Overall traffic counts (including both LTN roads and external roads) were reduced by −12% (NB. traffic reduced by −7% across Southwark as a whole during that time period). | NR | NR |
| Hammersmith and Fulham Council 202429 | Low traffic neighbourhoods | NR | Traffic counts reduced on scheme roads by 58.8%, 53.3%, 39.2% and 43.9%. No significance testing was undertaken. | NR | Traffic counts mainly reduced on other roads surrounding scheme roads (although one section of main road saw a small increase of 3.2%). Traffic reduced on surrounding roads by 47.9%, 17.7%, 4.5%, 21.9% and 15.38%, which are lower than reductions seen on scheme roads, suggesting some potential spillover, but not complete displacement. | NR | NR |
| Stanley 202230 | Low traffic neighbourhoods | NR | In 2021, LTN sites had reductions in traffic counts in March and remained lower from July to November, averaging 1860 cars per day. Meanwhile, comparison sites had increases until July and plateaued at 4450 cars per day from July to November. | Self-reported decrease in car travel and increase in cycling, walking and public transport use since implementation. A positive shift in attitudes towards cycling was also reported, due to perceptions of increased safety, and a new sense of enjoyment for walking in the area was reported. Improved quality of life reported due to no longer living on a ‘through road’. | Air quality on boundary roads: From 2017–2019 to 2021, NO2 decreased by an average of 8% across all four boundary road sites. Among comparison sites (5 sites elsewhere in Oxford), these there was an average NO2 reduction of 17%. Accounting for the control, authors calculated an average relative increase in air pollution on the LTN boundary roads of 9%. Traffic counts on boundary roads: Traffic volume increased by 11.8% from 2019, in proportion to traffic volume changes in comparison sites. Authors calculate it is likely that 3.1% of additional traffic on boundary roads from the LTN. | Across all LTNs, there were greater numbers of people who fully supported and strongly objected to the LTNs from before to after implementation. Perceived levels of fear of antisocial behaviour and perceptions that the area is unsafe reduced since implementation. Some roads were perceived as being safer, due to less traffic, however some roads were perceived as being less safe (especially by female respondents), due to more youth groups ‘hanging around’ by the filters, creating an intimidating presence, and also due to an increase in mopeds and e-scooters. Social interaction (as indicated by ‘people regularly stopping to interact with people in their local area’) was perceived as having decreased since implementation. | NR |
| London Borough of Waltham Forest 202231 | Low traffic neighbourhoods | NR | During the LTN trial: Traffic decreased by 74%, 36% and 49% on three closure roads and increased by 41% and 127% on two closure roads. July 2016 follow-up (20–21 months): Traffic decreased by 34%, 77%, 97%, 92% and 92% on four closure roads and increased by 40% on one closure road. | NR | During the LTN trial: Traffic decreased by 33%, 86%, 60%, and 12% on four surrounding roads, and increased by 158%, 9%, and 101% on three surrounding roads. The overall change in traffic volume across all roads was a 22% decrease, indicating some but not complete displacement. July 2016 follow-up (20–21 months): Traffic decreased by 22%, 77%, 45%, 70%, and 77% on five surrounding roads, and increased by 26% on one surrounding road. The overall change in traffic volume across all roads was a 56% decrease, indicating some but not complete displacement (and a lower level than immediately after implementation). | NR | NR |
| Yang 202232 | Low traffic neighbourhoods | There was a statistically significant reduction in average NO2 across internal sites by 5.7% (95% CI 0.1%, 11.0%) in comparison with external control sites. | Traffic volume significantly reduced across internal sites relative to external control sites by 58.2% (p < 0.1). | NR | Air quality: There was a statistically significant reduction in average NO2 across boundary sites by 8.9% (95% CI 0.2%, 15.7%) in comparison with external control sites. Traffic volume: Traffic volume reduced across boundary sites by 13.4% relative to external control sites, but this was not statistically significant. | NR | The London Borough of Islington is the 6th most deprived local authority in England and Wales. No details on how the findings impacted on inequalities have been reported. |
| Tower Hamlets 202333 | Low traffic neighbourhoods | On scheme area local roads, average NO2 levels reduced by 28.01%, which is higher than comparable locations in other parts of the borough without the road closures (19.23% reduction). However, monitors were located where traffic had reduced and not on roads where traffic had increased. On boundary roads, the reduction in NO2 was very similar to the NO2 reduction on similar roads and streets in other parts of the borough. | Traffic reduced considerably on two roads. There were also (smaller) reductions on three other roads. Traffic increased considerably on two roads. Traffic also increased on one road. Three streets saw reductions in one direction and increases in the other. | NR | NR | The changes reduced car-enabled anti-social behaviour but also decreased perceived safety due to reduced natural surveillance from traffic and increased drug-dealing and criminal behaviour. Emergency services access was impaired. One delay (of an ambulance responder) was mentioned in qualitative evidence. Refuse collection was also impaired by road closures. Accessibility for those who rely on motorised transport for mobility was reduced. Area felt safer, cleaner and more pleasant to live in. | NR |
| Perez 202134 | Low traffic neighbourhoods | Results varied by area. A 33% reduction in NO2 levels was observed in one area, but no changes were observed in another. | NR | Perception that the spaces facilitated walking. | NR | Perception that the space facilitated social interaction and and a more relaxed environment. Families with children perceived greater ease of circulation but were cautious of a potential false sense of safety. Working people used the spaces to have lunch. Both young and older people felt the space was not designed for them and older people found it isolating. Some women considered the area to be less safe due to being ‘deserted’, however others reported greater safety due to the open space. | NR |
| Crane 201635 | Street adaptations | NR | NR | NR | NR | Cyclists feel healthier and more socially connected and meet more neighbours who ride bikes. The cycle path was perceived as being good for the safety of the cyclists and pedestrians. Some perceived that the path was built for outsiders (as a thoroughfare) rather than for residents. People who had to drive for their job (e.g., to deliver and/or carry heavy equipment), or work at night, felt disadvantaged because it made parking less convenient. | It is possible that those who felt least in control (e.g., those whose jobs involved driving or walking at night) may have been more socially and/or economically disadvantaged compared with people who were not affected in these ways. It could also be that those who were more socially and/or economically disadvantaged would have been less able to use the cycleway, due to not owning a bike. |
| PREVENT: Behaviour change | |||||||
| Perez-Martin 201836 | Walking school bus | NR | NR | Overall, 43.7% of children reported to have changed mode of travel from car to walking post- intervention. For children living less than 1000 m or more than 1500 m away from the school, the shift was reported to be significant. The intervention was most effective for children living far from the school [1500–2000 m] (Chi- square = 6.4862; p-value = .03904). | NR | NR | NR |
| Mendoza 202237 | Anti-idling | No significant change in air quality indicators, and change figures not reported. | NA | 38% reduction in idling time; 11% reduction in number of idling vehicles. | NR | NR | NR |
| Behavioural Insights Team 202238 | Anti-idling | NR | NA | At follow-up, 50% of drivers turned off their engine (significantly reduced from baseline: 37%, p < 0.01, N = 4704). | NR | NR | NR |
| Below 202220 | Traffic calming outside school | NR | Traffic volume decreased from 3366 to 2642 vehicles per day, although the COVID-19 pandemic and associated travel restrictions were not controlled for. | NR | NR | Fewer survey respondents (45% vs. 53%) felt somewhat or very safe crossing the road at follow-up compared with baseline. Very few respondents agreed that the street was at least a little safer following the intervention (28%). Two-thirds of survey respondents agreed that the street was at least a little more child-friendly (68%) and at least a little nicer place to be (69%). | NR |
| MITIGATE: Green barrier | |||||||
| Abjith 202221 | Green wall | Overall, there was no difference in PM10, and PM2.5 and PM1 were higher post-intervention, although this depended on wind direction. When the wind was blowing from the street towards the school, PM10, PM2.5 and PM1 were 40%, 42% and 44% lower on the other side of the green screen compared with pre-intervention. When the wind was blowing parallel to the street, PM levels were higher post-intervention. | NR | NR | NR | NR | All schools were in the London borough of Lambeth. |
| Tremper 201539 | Green wall | There was a decrease in pollution concentrations on the playground side of the screen by 24% for NO2 and 38% for PM10 (from July to September, when the ivy had started to grow); both significant. Comparing school hours independently a reduction in concentrations of up to 36% and 41% were found for NO2 and PM10, respectively. | NA | NR | NR | NR | NR |
| Tremper 201840 | Green wall | 21.8% decrease in mean daily pollution concentrations on the playground side of the screen by final follow-up, once the screen had matured. Compared with the road side, mean daily NO2 concentration on the playground side was 4.6% lower after one month, 8.1%, 4.2% and 9.9% lower after 2 months, 3 months and 2 years, respectively. | NA | NR | NR | NR | NR |
| AVOID: Early warning system | |||||||
| Giancolo 2021,41 Mangia 202042 | Early warning system | PM10 concentrations were higher in Tamburi (intervention area) than in Talsano (control area) throughout the whole observation period, although the difference was smaller after the intervention was introduced. At the beginning of the observation period, PM10 concentrations in Talsano (control area) were 24.1 𝜇g/m3 (95% CI: 22.6 to 25.7), and were 8.2 𝜇g/m3 higher (95% CI: 5.6 to 10.8) in Tamburi (intervention area). The difference between the areas following the intervention was 6.1 (95% CI: −11.2 to −1.0). There were no difference in slopes pre- and post-intervention. In terms of time of day effects, on TP wind days, concentrations of PM10 did not decrease between 12:00 and 18:00, but there was a reduction in concentrations during those hours on the FN days. Highest levels of PAHs were recorded on non-wind days (both TN and FP), but concentrations of SO2 concentrations were higher on wind days, and increased during the central hours (12:00 to 18:00). | NA | NR | NR | NR | NR |
Eight studies reported on school streets interventions. These involved the temporary closure of streets in front of the school/s to motor vehicle traffic at drop-off and/or pick-up times.
In terms of the impact of school streets interventions on air quality, three studies reported a positive effect17,18,21,22 and one study reported a mixed effect.24 No studies reported a negative or neutral effect.
Five studies reported a positive effect on traffic volume.17,18,19–21,25 Some studies reported that traffic was higher on nearby roads (spillover), but this increase was not as large as the reduction on the school road in any study.17,18,19,25 No studies reported a negative or neutral effect.
Two studies reported a positive effect on modal shift away from motorised transport towards walking/wheeling.19,23,24 One study reported an increase in walking,22 2024), and one study reported minimal change in pedestrian numbers but increased cycling at one site.17,18 No studies reported a negative effect.
In terms of perceptions, one study reported increased positive and decreased negative attitudes towards the scheme from baseline to follow-up.19 One study reported lower actual safety at follow-up than anticipated safety at baseline.19 Three studies reported improved perceptions of safety among parents and/or residents.19,20,23 One study reported qualitative findings to indicate support for the scheme, including parents realising the school was nearer than they previously thought and they would allow their children to walk to school independently if the scheme were made permanent.23 An increased sense of community was reported in one study, due to parents and teachers meeting and chatting with other community members in the morning.25
Eight studies reported on low traffic neighbourhoods interventions. These involved restrictions to traffic on particular residential streets, mainly incorporating a modal filter (through the installation of bollards or planters, which allowed bicycles and pedestrians through but not motorised vehicles), although one such scheme used number plate recognition cameras rather than a physical barrier.29 Some also included street improvements.31,33
In terms of the impact of low traffic neighbourhoods on air quality, two studies reported a positive effect32,33 and one study reported a mixed effect, with a reduction in NO2 observed in one area but no changes observed in another.34 For one study reporting a positive effect on air pollution, it was noted that monitors were located on roads where traffic had decreased but not on roads where traffic had increased, suggesting confounding.33 No studies reported a negative effect.
Five studies reported a positive effect on traffic volume,26,27,28,29–32 and one study reported a mixed effect, with reductions in traffic on some roads but increases on others.33
Some studies reported that traffic was higher on nearby roads (spillover), but there was only one study that reported an overall increase on nearby roads (relative to comparison sites).30 In all other studies, the increase in traffic volume on nearby roads was not as large as the reduction on the blocked road.26,27,28,29,31,32 One study reported a lower reduction in NO2 on nearby roads than on comparison sites (elsewhere in the same city), meaning an average relative increase in NO2, suggesting spillover from the scheme,30 however another study reported a significant reduction on nearby roads relative to comparison sites.32
One study reported modal shift away from motorised transport towards walking, cycling and public transport use.30 One study reported a positive effect on physical activity.34 One study reported an increase in cycling across all roads in scheme areas.27
In terms of perceptions, one study reported that the introduction of the low traffic neighbourhood polarised opinion, with greater numbers of people fully supporting and strongly objecting to the scheme at follow-up compared with baseline.30 Safety was reported as both being improved, due to lower levels of traffic and car-enabled anti-social behaviour, but also reduced, due to increased perceptions of anti-social behaviour, drug dealing and criminal behaviour, and reduced natural surveillance from traffic.30,33,34 One study reported that the road closures adversely impacted on emergency service access, refuse collection, and accessibility among those who rely on motorised transport for mobility.33 In one study, positive attitudes to walking and cycling following implementation were reported,30 and another study reported that the area felt cleaner and more pleasant.33 One study reported that the space facilitated social interaction, although both the older and younger people interviewed felt the space was not designed for them.34
One study reported on a street adaptation intervention. This involved the installation of a cycle lane created by reducing traffic space on a main road.35
No data on the impact of the intervention on air pollution, traffic or behaviour change were reported. There were mixed findings relating to how the cycle lane was perceived and used. Locals and business owners reported choosing to cycle and use the cycle lane, although some reported dangers and inconvenience. People who had to drive for their job (e.g., to deliver and/or carry heavy equipment), or work at night, felt disadvantaged because it made parking less convenient. The cycle path was perceived as improving safety for cyclists and pedestrians, although some perceived that the path was built for outsiders (as a thoroughfare) rather than residents.
One study reported on a walking school bus intervention. This involved children walking to school along a pre-specified route designed to cover residences of children attending school, at a pre-specified time, supervised by adults in the role of monitors.36
No data on the impact of the intervention on air pollution or traffic were reported. A positive effect of the walking school bus initiative on modal shift was reported, in that more families walked or wheeled to school and fewer families travelled to school by car. This was most pronounced for those living 1.5-2 km from the school.
Two studies reported on anti-idling interventions. One involved displaying a sign asking drivers to turn off their engines.38 The other did not report details of the intervention.37
Both studies reported a positive effect on idling.37,38 One study reported no significant change in air quality indicators, however neither specific data nor change figures were reported.37
One study reported on a traffic calming intervention outside a school. This involved an image painted on the carriageway, designed to slow traffic.20
The intervention had a positive effect on traffic volume (although this was potentially confounded by the COVID-19 pandemic, when vehicle numbers reduced nationwide due to lockdown restrictions). The intervention had a negative impact on perceived safety, in that fewer respondents felt somewhat or very safe crossing the road at follow-up compared with baseline, and very few respondents perceived the street as being at least a little safer following the intervention.
Three studies investigated green barrier interventions. These involved an ivy planted barrier being installed behind the fence bordering the road and enclosing the school playground.
In terms of the impact of green barrier interventions on air quality, two studies reported a positive effect39,40 and one study reported a mixed effect, depending on wind direction.21 Specifically, when the wind was blowing from the street towards the school, PM10, PM2.5 and PM1 were lower on the other side of the screen, whereas when the wind was blowing parallel to the street, PM levels were higher on the other side of the screen, post-intervention.21
One study reported on an early warning system. This involved a request to a large factory to reduce its emissions by 10% on days when the wind was expected to blow towards the neighbourhood nearby for a sustained period of time (3 hours or more).41,42
This intervention had a mixed effect on air pollution. There were reduced air pollution levels relative to a control neighbourhood overall following the introduction of the initiative, but effects differed by time of day and whether or not wind was forecast.
No studies reported on their findings in relation to social inequalities, and very few studies reported on inequalities in general. Three studies reported that their intervention took place in areas of high deprivation; one green barrier study,21 one low traffic neighbourhood study32 and one school streets study.22
One study, evaluating a low traffic neighbourhood scheme, reported that those who rely on motorised transport for accessibility reasons were disadvantaged by the intervention.33 Another study, evaluating the introduction of a cycle lane,35 reported that those with less control (e.g., with jobs that involved walking or driving at night) may have been disproportionately disadvantaged by the intervention, and those more socially/economically disadvantaged would have been less able to use the cycle path (by virtue of being less likely to own a bike).
This review aimed to synthesise research evidence examining the effectiveness and acceptability of a comprehensive range of neighbourhood-level interventions to reduce outdoor air pollution. We identified a range of neighbourhood-level interventions with the potential to reduce outdoor air pollution locally, which local authorities, schools and community organisations could choose from. Evidence suggests that low-traffic neighbourhoods, school streets, anti-idling messages and green walls can be effective for reducing air pollution or proxy measures (e.g., traffic volume, modal shift), although there is little evidence relating to other interventions examined (street adaptations, walking school bus initiatives, traffic calming initiatives, and an early warning system). School streets appeared to be generally acceptable, whereas low traffic neighbourhoods were mixed, with both benefits and detriments to safety, and potential issues around emergency access and accessibility.
Many of the interventions examined in the current review aimed to increase walking and cycling, or have an incidental impact, which is one of the recommendations of the 2017 NICE guidance on outdoor air pollution. None of the interventions, however, examined smooth driving, and only one focused on speed reduction. Similarly, promoting walking and cycling and reducing traffic air pollution were recommended in the 2018 PHE recommendations,2 although urban planning design was also suggested, and has not been evaluated at a neighbourhood level as far as we can ascertain.
The quality of the evidence was poor to moderate. The main limitations in the evidence base were a lack of comparison sites in some studies, and potential confounding by the COVID-19 pandemic and citywide or regional interventions introduced during the study period (e.g., the Ultra Low Emissions Zone in London), both of which will have altered traffic levels in the area of study between pre- and post-intervention measurements. Many included studies were reported in the grey literature, in reports and on web pages, and many such evaluations could have benefitted from more pre-planning. In addition, the health effects of these interventions are unknown, as this was not captured in the literature.
Measurement issues could also have confounded findings. Accurate measurement of air quality is difficult to attain and can depend on the type and location of sensors. More accurate sensors are also more costly, and many studies relied on more affordable sensors, such as diffusion tubes, which can assess air quality over a longer period but are not sufficiently sensitive to detect time of day changes. The placement of sensors can also be important. For instance, one study reported potential confounding through placement of sensors only on streets where traffic subsequently reduced and not those that saw increased traffic counts.33
The studies focused on small area and neighbourhood-level interventions. Air pollution is dispersed over a wide area, including across international boundaries. Small area interventions, such as those included in this review, are unlikely to have a large impact on these macro-level trends, where they are not part of a wider-area programme of measures to improve air quality. The efficacy of the interventions would need to be considered in the context of their contribution to a broader programme of interventions, including those at policy- and infrastructure-level to improve air quality over a wide area.
Most studies did not conduct follow-up over long-term timescales, with many initiatives evaluated shortly after their introduction. Only one study assessed the impact of an intervention three years later,40 with another study examining follow-up data at 21 months.31 Outcomes were examined at 1 year for four interventions,27,29,35,39 although one of these studies did not report on air quality or any proxy measure.35 Some studies did not clearly report follow-up time periods. Air quality and pollutant dispersal fluctuates greatly with seasonal and temperature changes. The short duration of many of the studies meant that the effect of such seasonal variation and temperature fluctuation was not considered.
Finally, each of the initiatives was investigated in isolation. We did not identify any research that evaluated the effectiveness of combined approaches, for instance a green wall on a street with a school street. This could be explored in further research.
The review was strengthened by inclusive search processes, in which traditional database searches were supplemented by systematic searches of grey literature sources and stakeholder consultation. The use of a conceptual framework to guide the review process also represents a strength of the method. The review was informed by an advisory group consisting of stakeholders with a range of professional perspectives, including several different local authority departments across the UK, a variety of academic research specialisms, and government organisations such as the UKHSA and OHID. The review team also included a local authority collaborator working in public health practice (SH), which enabled us to consider elements of value to policymakers.
The remit of the review was to focus on neighbourhood-level interventions for addressing outdoor air pollution. This meant excluding interventions operating at different levels (e.g., national, regional and citywide). Many practitioners may be seeking wider-area initiatives to gain better ‘value for money’ and create a culture of clear air. We also recognise that many of the neighbourhood-level interventions reviewed were operating in areas where regional or citywide interventions were already in place or in the process of being operationalised.
Differences in terminology may have led to potentially relevant interventions being missed. We attempted to mitigate this through extensive stakeholder consultation prior to commencing the review, by asking stakeholders to provide us with types of interventions and terms used to describe the various schemes. For instance, many places avoid using the term ‘low traffic neighbourhood’ to describe these types of schemes, due to undesirable perceptions and conspiracy theories surrounding such schemes, instead preferring terms such as ‘active travel zone’ or ‘active travel neighbourhood’.
In this systematic review, we have identified a range of neighbourhood-level interventions with the potential to address outdoor air pollution, as part of a broader strategy to address air quality more generally. From the evidence reviewed, it seems that school streets and low traffic neighbourhoods can reduce traffic (and air pollution), in a way that avoids complete displacement of traffic to other areas, and with some evidence of modal shift. However, the mixed acceptability of low traffic neighbourhoods (and in particular safety and accessibility concerns) should be borne in mind. In some cases, very simple interventions can impact on behaviour at least, for instance, a sign reminding drivers to switch off their engines while stationary.
The findings of this review will support policy makers by identifying evidence-based interventions to include in policy and action plans to manage and improve air quality (for example Local Air Quality Management processes and Air Quality Action Plans in English local authorities). Many local authorities and communities already undertake actions at local level to improve air quality. To build and develop the evidence base of what works to improve air quality at neighbourhood level, it is imperative that local policymakers evaluate and publish the work that they do.
The studies included in this review provide evidence to support what communities, and local actors can do at a neighbourhood level, despite their limitations when set against the impact of wider social and industrial forces. The evidence from these studies can support and empower local communities to act to improve air quality in their neighbourhoods.
When developing neighbourhood-level interventions, practitioners should consider the population living in the target neighbourhood and ensure that the intervention is acceptable and relevant to their needs. Developing the intervention in consultation with residents may be one way to do this.
Further research is needed to examine the effectiveness of neighbourhood-level interventions to address outdoor air pollution, in particular for street adaptations, walking school bus initiatives, anti-idling initiatives, traffic calming outside schools, and early warning systems. School streets and low traffic neighbourhoods are relatively well evidenced, however research into these initiatives would benefit from more robust methods, with advance planning and consideration of the measurements needed, reliable measurement made before and after the introduction of the intervention, long-term follow-up, comparison sites, and robust assessment of air quality. Local authorities have sufficiently advanced traffic data and modelling and air pollution monitoring capability to provide good baseline data, and this could be utilised when planning an intervention. Some assessment of health outcomes would be useful for public health practitioners and policymakers. Research findings and evaluation of neighbourhood initiatives should be made available, preferably in the public domain, to enable future evidence synthesis to be as inclusive and comprehensive as possible.
We identified a range of neighbourhood-level interventions with the potential to reduce outdoor air pollution locally, which local authorities, schools and community organisations could choose from. The most impactful appear to be low-traffic neighbourhoods, school streets, anti-idling messages and green walls, although there is little evidence relating to other interventions at neighbourhood level.
Air quality improvements can improve the health of whole populations within a geographic area. This is particularly the case for those who are most vulnerable to ill health and for whom the consequences of ill health are the greatest. This includes children, older people and those in the most deprived communities where other factors, such as working conditions or housing quality, play a role. The findings of this review will contribute to the evidence of what works to improve health and wellbeing and complement interventions at city-wide or regional level to reduce air pollution from human activity.
Provide sufficient details of any financial or non-financial competing interests to enable users to assess whether your comments might lead a reasonable person to question your impartiality. Consider the following examples, but note that this is not an exhaustive list:
Sign up for content alerts and receive a weekly or monthly email with all newly published articles
Register with NIHR Open Research
Already registered? Sign in
If you are a previous or current NIHR award holder, sign up for information about developments, publishing and publications from NIHR Open Research.
We'll keep you updated on any major new updates to NIHR Open Research
The email address should be the one you originally registered with F1000.
You registered with F1000 via Google, so we cannot reset your password.
To sign in, please click here.
If you still need help with your Google account password, please click here.
You registered with F1000 via Facebook, so we cannot reset your password.
To sign in, please click here.
If you still need help with your Facebook account password, please click here.
If your email address is registered with us, we will email you instructions to reset your password.
If you think you should have received this email but it has not arrived, please check your spam filters and/or contact for further assistance.

Comments on this article Comments (0)