Keywords
End-of-life care, Costs, Children and young people, Cancer, Costs drivers

End-of-life care, Costs, Children and young people, Cancer, Costs drivers
Cancer accounts for nearly 30% of all deaths in the United Kingdom,1 with around 500 children and young people (CYP) dying with cancer annually.2 For patients whose disease becomes incurable, progressive, and advanced despite having received curative treatment, their care shifts towards end-of-life (EoL) care.3
The National Health Service (NHS) in England defines end-of-life care as the care needed when a patient is approaching the end of their life and may require the involvement of multiple professions, as well as hospital-based and community-based services.4 While end-of-life care is focused on supporting patients expected to die within the next 12 months to live as well as possible until their death, predicting death is often uncertain, and some paediatric patients may survive beyond this timeframe into adulthood.5 Furthermore, for patients whose death is ‘unexpected’ due to acute events (e.g., treatment-related toxicity, sepsis, or cardiopulmonary events) rather than natural disease progression, planning end-of-life care is particularly challenging.6
Following the end-of-life care strategy set out by the Department of Health in 2008, the UK expanded end-of-life cancer services for CYP.7 Despite progress in implementation,8 little is known about the nature of costs incurred in the year leading to death, including the intensity of care provided to this population, the resources utilised, or the value generated for both recipients and the NHS.4,8 A vital step in addressing this gap is quantifying the associated resource use and costs. Beyond accounting and reimbursement, care costs serve as a valuable proxy for overall care provision and a measure of NHS productivity,9 providing a single numeraire to compare various settings. Although EoL services are delivered across hospital, hospice and home care settings,4,7,10 this study focuses specifically on hospital-based care due to data availability.
Previous research indicates that a substantial proportion of end-of-life care is delivered in hospital settings, with diagnosis and cause of death serving as key factors influencing care intensity. Although these studies8,11–14 did not focus solely on CYP or cancer patients, they demonstrated that most end-of-life care recipients died of cancer and that hospital-based end-of-life services carry significant resource implications for the NHS. Furthermore, most of the limited evidence on end-of-life care costs in CYP originates from North America, potentially limiting its direct applicability to the UK given fundamental differences in healthcare funding and organisation.7
The paucity of health economic evidence on end-of-life cancer care in CYP has been linked to methodological challenges which border on defining, quantifying and valuing appropriate outcomes for end-of-life care in CYPs10,15,16 and how to account for the burden of cost falling across multiple stakeholders and sectors.16
To enhance understanding of the resource use and costs, and variation in end-of-life secondary care provided to CYP with cancer, this research aimed to quantify costs, assess factors associated with higher costs, and explore how these differed by secondary care settings. This provides a starting point and platform for future research to assess equity and efficiency in end-of-life care services for this population.
A Parent Advisory Panel (PAP) comprising fifteen bereaved parents from the Martin House Research Centre Family Advisory Board was established for the ENHANCE study. The PAP was involved throughout the research, from grant writing to dissemination. They advised on the study design, selection of outcomes measures, and met regularly to discuss findings. Additional guidance regarding the study design, specifically concerning the use of confidential patient information without consent was provided by the Paediatric Oncology Reference Team (PORT, a group of parents in the UK who have direct experience of children’s cancer). A parent co-applicant (GLW) was a member of the research team. She engaged through regular meeting contributions, co-authoring, and dissemination efforts.
This primarily descriptive analysis uses data from a death-outcome defined retrospective cohort study. It includes CYP aged 0 to 24 years who died between 01.01.2012 to 31.12.2020, following a diagnosis of cancer between 01.01.1990 to 31.12.2020, and were identified from the national cancer registry and Office for National Statistics (ONS) records in England. Only deaths occurring within this period were included because, due to changes in data reporting, some treatment data were only available from 2012. The end date was set to limit the effects of the COVID−19 pandemic. While the study design is not intended to be causality analysis, as no data were available on the population of children with cancer who were treated but did not die, we used causal inference methods to adjust for appropriate confounders in the population of children who died. Further details on the study design are available elsewhere.17 This study is reported in accordance with the RECORD guidelines.18
We utilised data from seven population-level datasets: National Cancer Registration and Analysis Service (NCRAS), Systemic Anti-Cancer Therapy (SACT), Radiotherapy Data Set (RTDS), ONS death registration records, Hospital Episode Statistics (HES), Paediatric Intensive Care Audit Network (PICANet), and Intensive Care National Audit and Research Centre (ICNARC) datasets. These were linked by NHS England to build the analysis dataset summarised in Figure 1. The linkage of these datasets enabled recording of patients’ comprehensive care, from point of cancer diagnosis to death.
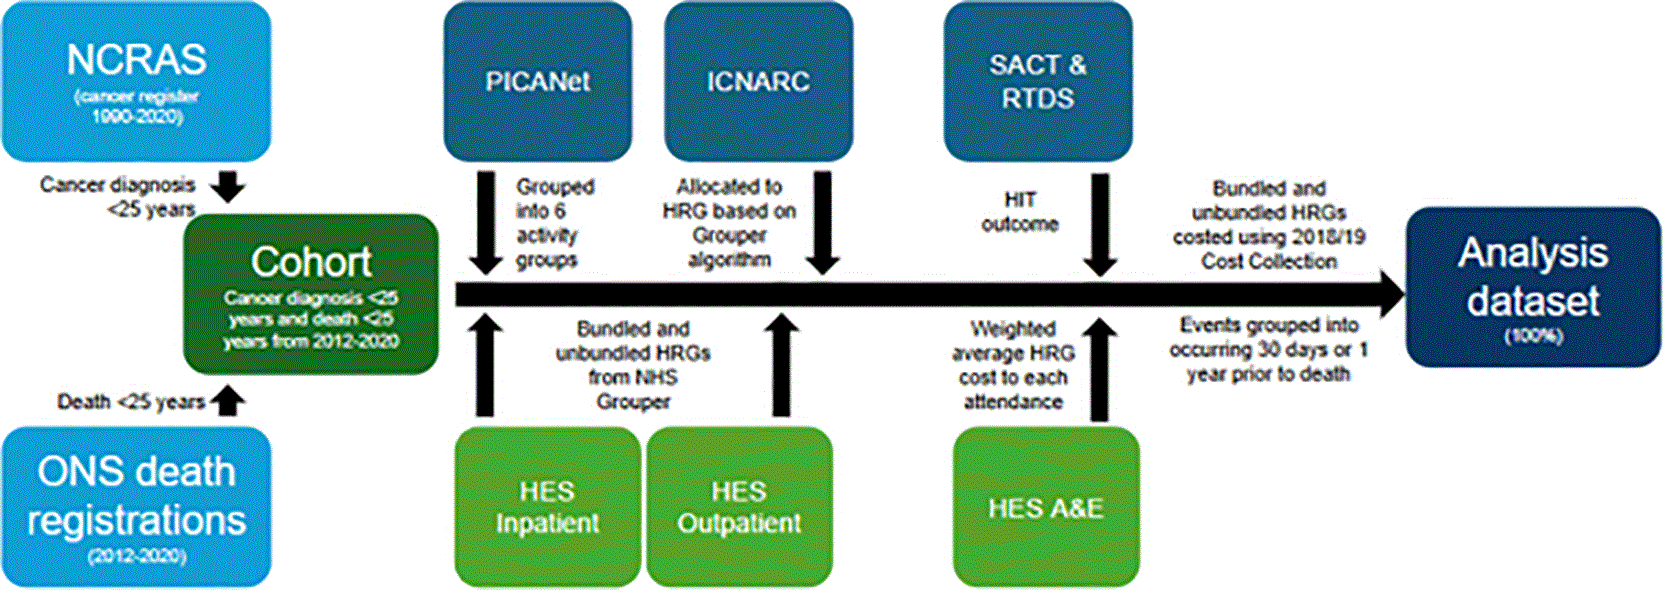
Abbreviations: A&E, Accident and Emergency; HES, Hospital Episode Statistics; ICNARC, Intensive Care National Audit and Research Centre; NCRAS, National Cancer Registration and Analysis Service; ONS, Office for National Statistics; PICANet, Paediatric Intensive Care Audit Network; Radiotherapy Data Set, RTDS; SACT, Systemic Anti-Cancer Therapy.
The primary dataset, NCRAS, is a population-level cancer register containing records on all patients diagnosed with cancer in England.19 SACT records chemotherapy data20 and RTDS, radiotherapy data.21 The HES database holds records of episodes of care for all admitted patient care (APC),22 outpatient (OP) appointments, and accident and emergency (A&E) attendances to NHS hospitals across England. A care episode, defined as a finished consultant episode (FCE), represents a continuous period of care under one consultant at a single provider. PICANet and ICNARC databases contain daily care records on all patients admitted to paediatric and adult intensive care units (PICU, ICU) respectively.
The use of patient identifiable data without consent for the linkage of datasets was reviewed and advised by the Confidentiality Advisory Group (ref: 21/CAG/0026), and ethical approval subsequently granted by the Northwest - Greater Manchester Central Research Ethics Committee, under the Health Research Authority (ref: 21/NW/0009).
Primary outcomes were mean and median costs in the last year (LY) and last month (LM, defined as 30 days) of life, stratified by patient, treatment and provider characteristics, and care setting. Secondary outcomes included treatment, demographic, and clinical characteristics associated with higher costs.
The analysis cohort was grouped and described based on characteristics defined in the published protocol for the End of Life care for infants, children and young people (ENHANCE) study,17 alongside input from the project study steering committee and expert collaborators.
Demographic characteristics comprised age at death, grouped into five age bands (<1, 1–4, 5–9, 10–17, 18+); sex (male and female); ethnicity into four groups (White, Black, South Asian, Mixed/Other); and deprivation stratified into quintiles, where 1 represents the most deprived. Deprivation is based on the English Index of Multiple Deprivation (IMD) 2019,23 which ranks geographical areas based on seven domains, including income, health, housing, and education.
Clinical characteristics included cancer type and high-intensity treatment (HIT). Primary cancer type was defined based on 12 International Classification of Childhood Cancer (ICCC) groups24 and then aggregated into three groups (haematological, central nervous system (CNS), and non-CNS solid cancers), reflecting different care and resource use pathways. A derived binary characteristic of high-intensity treatment at the end of life was defined in line with the study protocol,17 constituting any one or more of the following high-intensity treatments: intravenous chemotherapy within 14 days of death; two or more visits to the emergency department; two or more hospital admissions, or one or more intensive care unit admissions within the last 30 days of life.
Provider characteristics included 19 providers designated as principal treatment centres (PTCs) for children and teenagers and young adults (TYA) with life-limiting conditions in England.
Costs were estimated using a costing approach based on the NHS internal remuneration system, underpinned by Healthcare Resource Groups (HRGs) categorisation across all secondary care services. HRGs, core and unbundled, are standard categorisations of clinically similar patient groups, with comparable healthcare resource use. Core HRGs are derived from the diagnosis and procedures in an FCE, while unbundled HRGs capture specific high-cost components (e.g., expensive medicines, imaging, and critical care) that are excluded from core classifications.25 These costs were then subjected to regression analysis to explore the association of key patient characteristics with cost. Costs were estimated from an England hospital perspective and reported in 2019/2020 British pound sterling (£), reflecting resource use costs in the financial year of data analysed.
Using routine patient-level data, the direct costs associated with FCEs across APC, OP, and A&E settings, and daily care in PICU and ICU were estimated separately and then aggregated to obtain total costs for the last year of life and last month.
To cost APC and OP care, we first applied the NHS HRG4+ 2018/19 Reference Cost Grouper software to classify into core and unbundled HRGs, the care activities from FCEs in all included financial years. These HRGs were matched to corresponding unit costs26,27 obtained from the NHS 2018/2019 National Cost Collection data publication.28 Although, a specific grouper exists for each financial year, we utilised the 2018/19 software to ensure consistency across the study period using the most contemporary pre-pandemic unit costs available. For unmatched HRGs, we imputed mean costs using either costs obtained from the 2019/2020 National Cost Collection data publication29 or the mean pre-imputation cost of core HRGs; alternatively, we assigned specialist elicited costs.
To cost A&E, PICU and ICU care, alternative approaches were applied, primarily due to unavailability of key data fields required to derive HRGs using the Grouper software. The costs associated with A&E attendances were estimated using the weighted average for emergency care activity as reported in the NHS 2018/2019 national cost schedule.
PICU and ICU costs were estimated on a per diem basis using the NHS 2018/2019 national cost schedule. To derive HRGs for PICU care, we applied the grouping logic reported in the HRG4+ 2018/2019 Reference Costs Grouper chapter to manually group critical care data based on key respiratory and/or cardiovascular support provided daily to patients under critical care. In contrast, the grouping logic for the derivation of HRGs for ICU care is based on the number of organs requiring support.30 We subsequently matched HRGs to corresponding unit costs from the NHS 2018/2019 schedule.
A series of Mixed Effect Generalized Linear Model (MEGLM) regression models were used to explore the associations between costs over the last year and last month (main outcomes), presence of high-intensity treatment (main exposure) and other demographic and clinical variables. A directed acyclic graph was drawn in dagitty (see Figure 2) and used to define the expected causal relationships between variables including the main exposure and secondary exposures (age at start of model period, sex, ethnic group, IMD, and cancer category). The DAG was also used to determine the minimal adjustment set of confounders for each exposure-outcome relationship.31 Covariates were chosen based on input from expert clinicians.
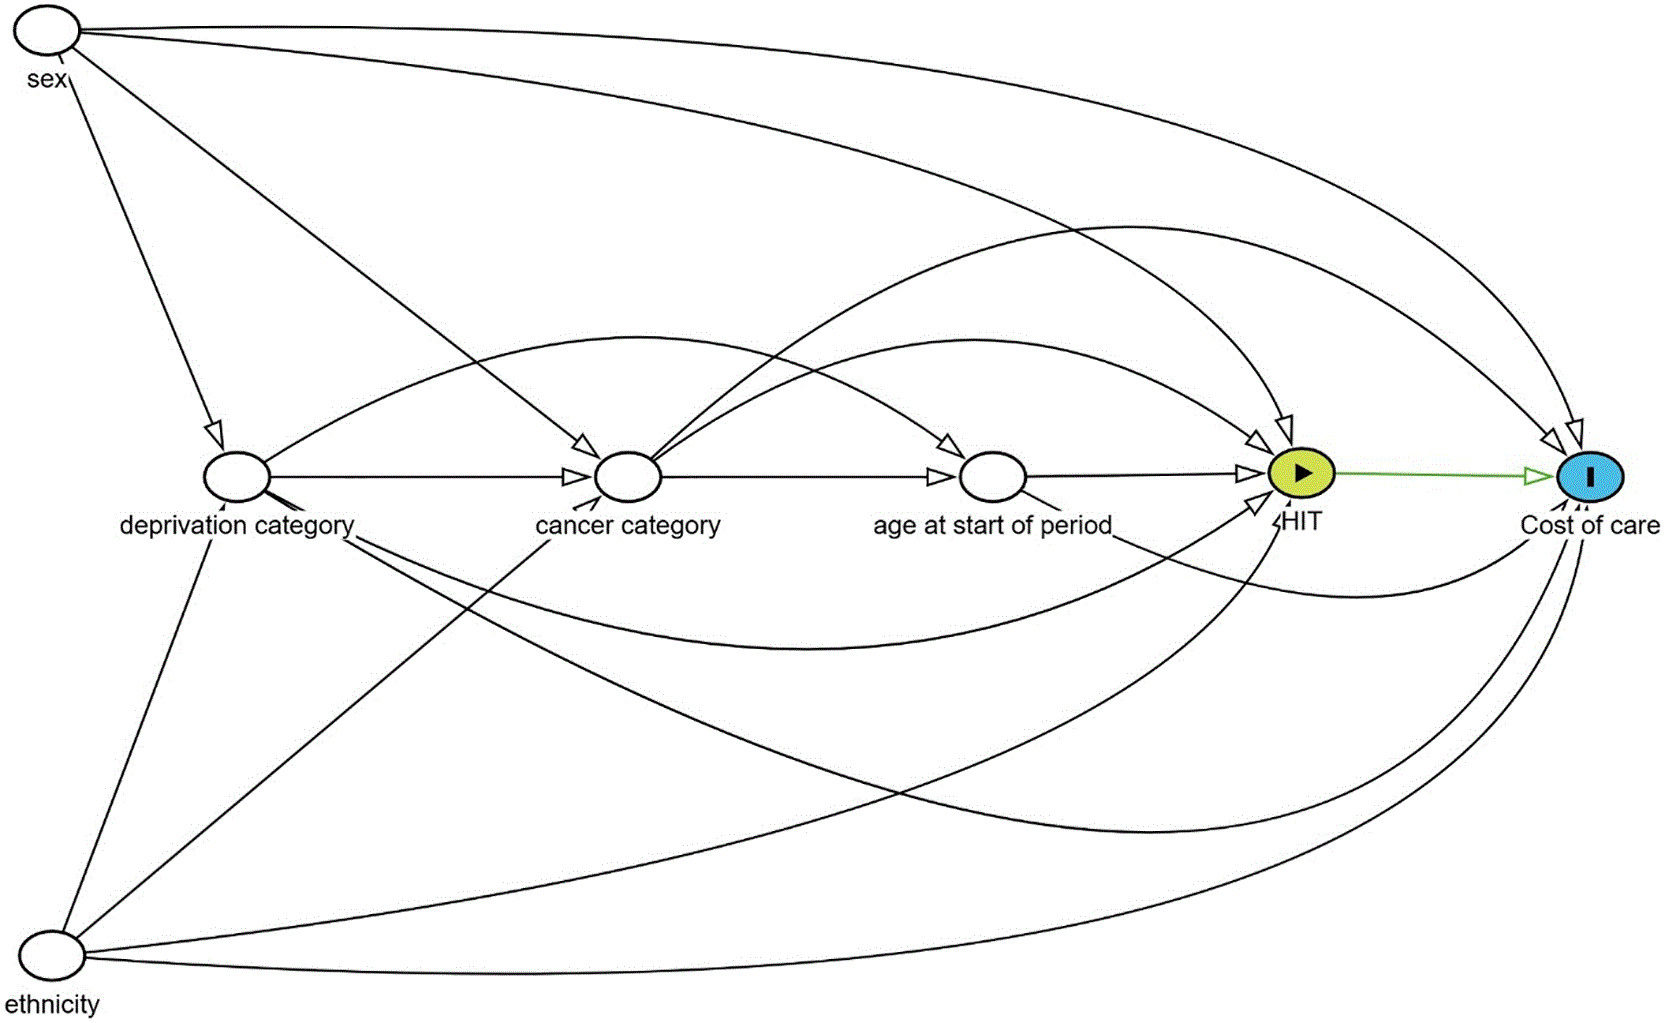
Abbreviation: HIT, high-intensity treatment.
All exposure variables were implemented as defined previously except age at start of model period which was the age one year or one month prior to death, with values under zero excluded to avoid survival time bias. As the data was clustered in treatment centres, these were included as a random intercept in the MEGLMs.
The MEGLMs specified a gamma distribution and a log link function. Unlike Ordinary Least Squares (OLS) models, MEGLMs are specifically designated to handle the right-skewed distribution and non-constant variance typical of cost data.32,33 Twelve models were estimated, covering each of the six exposures across both the last year and last month of life. The results reported are the regression coefficients for the post-log transformation exposure variable.
We conducted two separate scenario analyses, including (i) only patients who survived at least 1 year or (ii) at least 1 month following their initial diagnosis. While the study’s primary focus was costs for the average CYP during the specified periods, rather than the cost of a full year or month of end-of-life care, we explored the impact on cost estimates of excluding these patients. To assess post diagnosis survival, we also estimated the numbers of patients dying within 0–1, 1–3, 3–6, 6–9, and 9–12 months.
We conducted all data management and analyses using STATA version 18.0.34
Table 1 reports mean and median per patient healthcare costs by patient characteristics for our final sample of 4,247 children and young people who died between 01.01.2012 and 31.12.2020. The overall total mean cost (£11,754) in the last month was 111% higher than the monthly average cost (£66,773/12) in the last year of life. Patients who died between ages 1 to 4 years had the highest mean and median costs (£108,169 and £98,893, respectively) in their LY, exceeding the other age categories by margins ranging from 32% to 152% and 63% to 327%, respectively. In the last month, the under 1 s had the highest mean costs (£22,200) while the 1 to 4-year category had the highest median costs (£11,633), exceeding the other age categories by margins ranging from 2.5% to 221% and 18% to 114%, respectively. Children under 5 typically require more specialised, intensive and costly care compared to older children and young people, driving the observed cost disparities.35,36 For the last year of life and the last month, mean costs (£92,108 and £20,008, respectively) were 97% and 176% higher, while median costs (£76,073 and £12,090, respectively) were 163% and 426% higher for patients with haematological compared to the lowest cost category (CNS cancers). Care for CYPs with haematological cancers is resource intensive. Prolonged or frequent hospitalisations, intensive care admissions, and high-cost treatments (e.g., stem cell transplantation) and monitoring for these patients; drive the observed cost disparities.37 Across groupings in sex, IMD and ethnicity characteristics, the mean and median costs were similar both in the last year of life and last month.
Healthcare costs by treatment and provider characteristics are reported in Table 2. In the last year and last month, mean costs (£86,172 and £19,205, respectively) for patients who received high-intensity treatment were 89% and 432% higher than for those who did not receive high- intensity treatment (£45,567 and £3,608, respectively). Similarly, median costs during last year and last month were 114% and 1,011% higher for the high-intensity treatment group (£68,238 and £11,880, respectively) than for the No high-intensity treatment group (£31,911 and £1,069, respectively). By definition, components of HIT, including chemotherapy, multiple hospitalisations, intensive care admissions, represent high-cost healthcare resources that explain the disparity in costs. Costs by principal treatment centre are based on 91.6% of the total sample, representing patients with an identifiable PTC. The four highest-ranking centres in terms of cost (GOSH, Manchester, Birmingham Children’s, Alder Hey) had mean costs exceeding those of the lowest ranking centres in the last year (Sheffield TYA, Leeds, Clatterbridge, Leicester) and the last month (The Christie, Great North, Leeds, Clatterbridge) by an average of 65% and 170% respectively. Median costs in the last year were on average 79% higher in the four highest-cost centres (GOSH, Manchester, Birmingham Children’s, UCLH) compared to the lowest ranking centres (Cambridge, Sheffield TYA, Leeds, Leicester). While in the last month, median costs in the highest-cost centres (GOSH, Manchester, Birmingham Children’s Hospital and Alder Hey) exceeded those in the lowest-ranking centres (Southampton, Great North, Leeds, Clatterbridge) by an average of 342%. PTC total mean cost (£12,256) in the last month was 107% higher than the monthly average cost (£70,928/12) in the last year.
Table 3 reports health care costs by hospital care setting. APC services are the largest contributor of secondary care costs, accounting for 81.3% (£54,290) and 69.5% (£8,166) of mean total hospital care costs in the last year and the last month of life, respectively. In contrast, A&E care accounted for the least proportion of mean secondary care costs, 0.3% (£228) and 0.4% (£46) in the last year and the last month of life, respectively. The highest individual patient costs in the last year and last month of life were for the use of PICU (£560,842) and APC (£142,199) services, respectively. Resources utilised during prolonged/multiple hospitalisations and intensive care provision of respiratory or/and cardiovascular system support explains higher observed APC and PICU costs.
Results from our primary MEGLM models in Table 4 suggested that in the last year of life, high-intensity treatment had a large contribution to total costs, associated with £25,763 of additional care delivered. Costs were found to decline with age at the start of the model period, with patients who were under 1 at the start of their last year having the highest costs (£96,574) relative to the reference (18+). The cost associated with haematological cancers (£30,824) was higher compared to the reference (solid cancers). The model for last month of life showed that HIT was associated with £13,237 additional care. However, notably this effect was smaller than for the last year model signifying that this variable is additionally incorporating some characteristics not included in the models, as by definition the high-intensity treatment occurred in the last month of life. Compared with corresponding reference categories, patients aged under one year at the start of their last month of life or who had haematological cancer, had higher healthcare costs (£20,743 and £12,323, respectively). Across last year and last month models, variation in care costs by ethnicity and IMD was limited. Also, results suggested that neither sex, ethnicity, nor IMD had an impact on cost of care.
| Variable | Last year of life | Last month of life | ||
|---|---|---|---|---|
| Marginal Cost (£) | 95% CI (£) | Marginal Cost (£) | 95% CI (£) | |
| 1HIT at end of life (ref: No HIT) | ||||
| HIT | 25,763 | 21,602, 29,924 | 13,237 | 11,520, 14,954 |
| 2Age at start of model period (ref: 18+) | ||||
| 0–1 | 96,574 | 73,895, 119,252 | 20,743 | 11,975, 29,512 |
| 1–4 | 71,827 | 62,518, 81,136 | 15,422 | 11,864, 18,979 |
| 5–9 | 46,796 | 39,856, 53,736 | 6,540 | 4,509, 8,570 |
| 10–17 | 29,260 | 24,840, 33,679 | 4,136 | 2,761, 5,512 |
| 3Sex (ref: Male) | ||||
| Female | -1,086 | −5,522, 3,348 | −573 | −2,045, 898 |
| 4Cancer category (ref: Solid cancers) | ||||
| Haematological | 30,824 | 23,874, 37,773 | 12,323 | 9,287, 15,360 |
| CNS | −19,975 | −24,412, −15,538 | −2,313 | −3,534, −1,092 |
| 5Ethnicity (ref: White) | ||||
| Black | 2,135 | −8,278, 12,549 | 2,457 | −1,415, 6,330 |
| South Asian | 1,990 | −6,601, 10,582 | 2,485 | −705, 5,676 |
| Mixed other | 1,985 | −5,660, 9,630 | 2,948 | 46, 5,849 |
| 6IMD (ref: First) | ||||
| Second | −573 | −7,292, 6,146 | −628 | −2,869, 1,611 |
| Third | 3,112 | −4,049, 10,274 | −283 | −2,627, 2,061 |
| Fourth | −7,110 | −13,874, −346 | −1,151 | −3,472, 1,170 |
| Fifth | −4,688 | −11,773, 2,397 | −913 | −3,326, 1,500 |
Results from the scenario analysis in Table 5 showed that survival for least a year or month post diagnosis was associated with higher costs in some categories. Specifically, during the last year, costs for HIT (£30,510) was 18.4% higher, the 0–1 age group (£145,357) was 50.5% higher, and haematological cancers-related cost (£41,120) was 33.4% higher than corresponding estimates in the primary models (see Table 4). During the last month, costs for the 0–1 age group (£22,279) and haematological cancer patients (£12,418) were 7.4% and 0.8% higher, respectively, than corresponding baseline estimates. However, the categories associated with the highest costs remained consistent across both the primary and scenario analyses. Furthermore, the proportions of patients surviving at least a year and a month following their diagnosis (see Table 6) was 57.8% (2458/4247) and 90.6% (3849/4247), respectively. Correspondingly, the high proportions of those dying within 0–1, 1–3, 3–6, 6–9, and 9–12 months indicate that death soon after diagnosis is evident in this population.
We described resource use and costs of secondary care at the end of life for children and young people who died with cancer. We found large variation in healthcare resource use and costs across the full population analysed. Healthcare costs were consistently higher during the last month of life compared to the average monthly cost in the last year, reflecting an increase in care intensity and secondary care utilisation. Children who died aged under five and who died with haematological cancers accounted for the highest healthcare costs. While admitted patient care costs constituted a substantial proportion of total healthcare costs, paediatric intensive care was the key driver in the highest cost cases.
Although our results showed differences in the included numbers of deaths, with males, White patient groups, and the most deprived experiencing the highest mortality, we could not determine what proportion of the entire diagnosed cohort these figures represented, as our dataset lacked information on the numbers diagnosed with cancer. However, evidence in literature suggests that cancer incidence in children and young people is also generally higher in males, children of White ethnicity and of most deprived socioeconomic status.38
Large variation was also observed across principal treatment centres, this may partly be explained by different patient populations rather than just provider characteristics. However, it was not possible to interrogate these differences in our regression model. The key factors associated with higher costs at the end of life were age at the start of the model period, with care costs declining for older groups; haematological cancers; and receipt of high-intensity treatment. Minimal differences were observed across ethnicity and IMD.
Our findings, indicating that APC costs contribute a significant share of total healthcare costs at the end of life and that costs are higher in the last month of life, align with a UK study by Luta et al.13 Investigating costs for adults over 60 across various conditions, including cancer, the authors similarly found that mean total costs were higher in the last month of life, driven primarily by inpatient care. While Luta et al.38 considered primary care which the present study could not, both studies notably excluded end-of-life care provision from other sectors. Although we compare care costs between paediatric and adult populations, differences in cancer aetiology and therapeutic challenges such as limited paediatric treatments and long-term adverse effects warrant caution.39
Consistent with our findings, Noyes et al.35 estimated the total cost of paediatric palliative care in the last year of life, finding that APC accounted for the largest share of the total care costs. Similarly, a recent review by Prendergast et al.36 on care costs in the last year of life for children with life-limiting conditions highlighted that haematological cancers were associated with the highest costs, with hospitalisation costs remaining a primary driver of healthcare costs.
This is a pioneering study providing evidence to improve our understanding of the costs of care, key determinants of costs and variation in secondary care provision at the end of life for children and young people who die of cancer in England. Quantifying resource utilisation and costs using a robust patient-level dataset allows us to characterise the types of care provided to this population and understand the factors influencing costs and use of different secondary care settings. Furthermore, we apply a standardised approach to costing end-of-life care, based on the use of HRGs and UK national average reference costs to estimate the costs of healthcare activity at patient-level. Unlike national tariffs, reference costs account for variations in factors including patient case-mix and resource inputs that can influence costs across different providers of NHS services.40,41
We recognise, however, some limitations to our study. Our analysis assumes that the data analysed were coded appropriately and consistently, this may have an impact on both the level of costs and observed differences across PTCs. It was not possible to assess data quality, including any differences in data coding. Also, due to data limitations, we were unable to address potential bias due to any secondary cancer diagnosis. Additionally, the analysis dataset is limited to cancer patients who died; it therefore lacks a counterfactual group, as cancer survivors were not included. Further to this, the focus is on patients with cancer who died and it excluded CYP who did not have cancer and who died. The approach taken, similar to previous end of life studies,42–44 aligned with our primary objective of exploring high-intensity treatment among paediatric decedents. Furthermore, this offered the most efficient strategy by minimising data requirements.
The study focused on the hospital perspective, excluding resources used and care provided in other sectors, importantly the children and young people’s network of family and friends, hospices, primary care, social care and the third sector. These broader perspectives were outside the scope of this analysis; and in many cases the data required does not currently exist, however, it is expected that these sectors show similar variation across care provided and the costs associated with doing so.
While this study has demonstrated the scale of costs required to provide hospital care to this population, several theories have been proposed for the variation across key factors. These include both patient and clinical characteristics beyond those incorporated here such as differences in coding activity across principal treatment centres, the role of clinical trials, variation in components of care and specialised care services across principal treatment centres, and variation in quality and outcomes of care. It is also of utmost importance that the spillover implication of care is understood, both within the health and social care system as well as to the families.
There are several key implications for policy that have emerged from this analysis. The overall estimation of costs for CYP at the end of life provides stakeholders with clarity regarding the financial implications of care delivery under current service models. Our findings highlight high secondary care costs in end-of-life care for this population. These expenditures may represent a real opportunity cost for other patients seeking healthcare and should, therefore, be carefully considered. This is most evident in the significant cost implications of high-intensity treatment at the end of life. Where such intense care may not be the most appropriate form of care, it inadvertently restricts care access for patients elsewhere in the health system.45 It is therefore important that care providers are considerate of the appropriateness of the care provided and where feasible advanced care plans are implemented.
Additionally, significant variation in average costs was observed across PTCs. While the complexity of care makes it difficult to determine if this variation is appropriate based on case-mix and severity, it is important for stakeholders to ensure that access to care is consistent across all settings.
Finally, policymakers should view these results within the wider context of what is a highly complex and emotive area. While this study does not advocate for cost minimisation in end-of-life care, it would neither be appropriate nor equitable to ignore the financial implications. Instead, the goal is to understand current resource utilisation and progress toward a more effective and equitable allocation.
Costs and resources required to provide care to children and young people with cancer at the end of life are highly diverse, varying both between individuals and across secondary care settings and key characteristics. This study explores the delivery of hospital-based care, to inform wider consideration of how the NHS cares for children and young people with cancer and equity in care delivery. Unanswered questions remain about whether variation in cost is warranted, the impact for the patient of more intense care activity, and the cost of providing care in non-hospital settings. It is a complex picture, with many factors, observed and unobserved, to be considered.
The use of patient identifiable data without consent for the linkage of datasets was reviewed and advised by the Confidentiality Advisory Group (ref: 21/CAG/0026). Ethical approval for the use of data, including formal section 251 support allowing the linkage of datasets using identifiable information was granted by the Northwest - Greater Manchester Central Research Ethics Committee, under the Health Research Authority (ref: 21/NW/0009).
The data used in this analysis take two forms: NHS 2018/19 and 2019/20 National Cost Collection data which are publicly available, and administrative datasets obtained from NHS England, Intensive Care Audit Network (PICANet), and Intensive Care National Audit and Research Centre (ICNARC) via a specific data sharing agreement. These administrative datasets contain sensitive patient level data which cannot be shared more widely. Data can be requested from the provider organisations, subject to their approval processes.
Provide sufficient details of any financial or non-financial competing interests to enable users to assess whether your comments might lead a reasonable person to question your impartiality. Consider the following examples, but note that this is not an exhaustive list:
Sign up for content alerts and receive a weekly or monthly email with all newly published articles
Register with NIHR Open Research
Already registered? Sign in
If you are a previous or current NIHR award holder, sign up for information about developments, publishing and publications from NIHR Open Research.
We'll keep you updated on any major new updates to NIHR Open Research
The email address should be the one you originally registered with F1000.
You registered with F1000 via Google, so we cannot reset your password.
To sign in, please click here.
If you still need help with your Google account password, please click here.
You registered with F1000 via Facebook, so we cannot reset your password.
To sign in, please click here.
If you still need help with your Facebook account password, please click here.
If your email address is registered with us, we will email you instructions to reset your password.
If you think you should have received this email but it has not arrived, please check your spam filters and/or contact for further assistance.

Comments on this article Comments (0)