Keywords
Adverse birth outcome, low birthweight, macrosomia, health inequality, geographical region, socioeconomic status, England, China

Adverse birth outcome, low birthweight, macrosomia, health inequality, geographical region, socioeconomic status, England, China
Low birthweight (LBW), defined as a birthweight less than 2500 grams,1 and macrosomia, usually defined as birthweight above 4000 grams,2 are two adverse birth outcomes that pose significant challenges to maternal and child health globally. LBW is a major risk factor for infant mortality, and has serious consequences for health in later life.1,3,4 In England, the highest rates of infant mortality are among infants with LBW.5 In China, LBW has made up a growing proportion of overall infant deaths from 2004 to 2019.6 Macrosomia is associated with both maternal and neonatal morbidity and mortality; children born with macrosomia have a higher risk of developing insulin resistance, obesity, diabetes, early cardiovascular disease, and some cancers later in life.7,8 The burden of macrosomia and its associated adverse outcomes are increasing in both England and China due to rising maternal obesity and excess gestational weight gain.9,10
The co-existence of LBW and macrosomia reflects a dual burden of malnutrition and health inequality in England and China.11 The Office for Health Improvement and Disparities reported higher proportions of LBW babies in more deprived areas (9.2%) compared with least deprived areas (5.6%) in England in 2024.12 Data from the Office for National Statistics show that low socioeconomic status was associated with a reduced odds of macrosomia compared to higher socioeconomic status groups in England and Wales.13 In China, although the national prevalence of LBW remains below the global average, a persistent upward trend has been documented over the past three decades, with pronounced socioeconomic disparities.14 Conversely, the prevalence rate of macrosomia in China is higher than the average of 23 low-income and middle-income countries,15 and the reported prevalence varies considerably between different areas within China.8
Despite the growing interest in maternal and child health inequalities, existing research in adverse birth outcomes related to LBW or macrosomia primarily focus on individual countries, with limited studies focusing on cross-national comparisons. A systematic analysis estimating country, regional, and global prevalence of LBW in 2020 identified national and regional inequalities in LBW but did not provided cross-country socioeconomic comparisons.1 A cross- country comparison showed that socioeconomic gradients in LBW were apparent in the United States, the United Kingdom, Canada, and Australia.16 A study of macrosomia in 23 developing countries showed that the rise in diabetes and obesity in women of reproductive age could be associated with a parallel increase in macrosomic births, but it did not examine the association between geographical and socioeconomic status and macrosomia.15 To our knowledge, no study has compared patterns of geographical and socioeconomic inequalities in LBW and macrosomia between England and China.
This study aimed to address this gap by conducting an exploratory comparative analysis of inequalities in LBW and macrosomia between England and China, focusing on geographic regions and socioeconomic subgroups. Using routinely available data from England and China, this study aimed to examine the association between geographical regions of residence, socioeconomic status and adverse birth outcomes, and compare patterns of inequality between England and China. The findings are intended to inform cross-national learning on health inequalities in adverse birth outcome and support more targeted public health interventions.
Patients and the public were not involved in any stage of this research. As this study was a secondary analysis of routinely available, anonymised data, there were no opportunities for patient and public involvement in the design, conduct or reporting of the research.
This study was a retrospective cohort study using data from England and China.
We used two data sources for this study –the English National Hospital Episode Statistics Admitted Patient Care (HES APC) dataset and China Family Panel Studies (CFPS)dataset. The HES APC is a nationwide routinely collected administrative database which comprises information on all patients admitted for treatment at National Health Service (NHS) hospitals in England since 1998.17 An additional maternity section of HES APC includes birth and delivery information such as the baby’s birthweight, gestational age, and mode of delivery.18,19 Individual participant’s consent was not required for this study because the HES APC data used were fully anonymised by NHS England, and the study was conducted for public health purposes.
Since 2010, the CFPS has followed household members of all ages from around 16,000 households in 25 provinces in China, every two years.20 The CFPS uses a multistage probability proportional to size sampling with implicit stratification to ensure sample representativeness. Seven waves of the survey were carried out between 2010 and 2022. During each wave, children under sixteen years were surveyed where the basic information such as gestational age, birthweight and place of birth were obtained from the child’s parents or other primary caregivers. Informed consent forms were signed by participants aged ≥15 years or by their legal guardian (for participants aged ≤15 years).
All birth episodes in an NHS hospital from 2013 to 2023 were extracted in HES APC and data were linked to any hospital admission from 2003. The study population included all singleton and first-born children with complete data on birth weight and gestational age at birth. The final analytic dataset consisted of 1,629,679 infants in the English cohort (see the flowchart of identification of study population in supplemental material).
The cohort for the CFPS cohort included data from 2010 to 2022. The study population included all singleton, first-born children aged 2 years or younger at the time of survey with available birth weight and survey characteristics (primary sampling unit, strata, and weight). The final analytic dataset consisted of 5,164 children in the cohort. (see the flowchart of identification of study population in supplemental material).
The outcomes were LBW and macrosomia. LBW was defined as birthweight of less than 2500 g and macrosomia was defined as birthweight of more than 4000 g.
The exposure included geography and socioeconomic status. The variables for geography were urban/rural, and region. Considering there are North-South differences in England and East-West differences in China in social, economic, and cultural aspects, the regions were divided in to the North, Midlands, London, and South areas in England and the Western, Central, and Eastern areas in China.
Socioeconomic status was measured using neighborhood-level income in England whereas the measure in China used individual-level income. Neighborhood income was defined based on the income domain of the Index of Multiple Deprivation, which is an official area-level measure of relative deprivation derived from information about income, education, employment, crime, and the living environment in England.21 Neighborhood income was categorised into quintiles in the English dataset, whereas annual net household’s income per capita was categorised into quartiles in the Chinese dataset.
A Directed Acyclic Graph was used to select the final list of covariates to be included in the multivariable regression model (see supplemental material Figure S1). Based on the availability of covariates, multivariable models for the English dataset included maternal age in 5-year categories, ethnicity (categorised into White, Black, Asian, Mixed, other including Chinese), substance misuse/smoking (yes/no), and obesity/overweight (yes/no). Multivariable models for the Chinese dataset included child’s sex and ethnicity (categorised into Han and other) and maternal age in 5-year categories, smoking (yes/no), and obesity/overweight (defined as body mass index ≥24) (yes/no).
Descriptive statistics (counts and percentages) are presented to describe the study population by LBW and macrosomia. The proportions and 95% confidence intervals (CI) of LBW and macrosomia were estimated across urban/rural, subnational region, and socioeconomic groups. Poisson regression models with robust variance were used to compute risk ratios (RR) and their 95% CI to examine the associations of geographical and socioeconomic factors with LBW and macrosomia. Three models were run in multivariable Poisson regression. For the English dataset, model one adjusted for maternal age, ethnicity, smoking, and obesity/overweight; model two included additional adjustment for neighborhood income (model one = model two when the associations of neighborhood income with LBW and macrosomia were examined); model three was the fully adjusted model, including maternal age, ethnicity, smoking, obesity/overweight, urban/rural, region, and neighborhood income. For the Chinese dataset, model one adjusted for child’s sex and ethnicity, and maternal age, smoking, and obesity/overweight; model two included additional adjustment for per capita household income (model two = model one when the associations of per capita household income with LBW and macrosomia were examined); model three was the fully adjusted model, including child’s sex, ethnicity, urban/rural, region, and per capita household income, and maternal age, smoking, and obesity/overweight.
For the English dataset, we used a complete case analysis as missing data were less than 5%. For the Chinese dataset, we conducted multiple imputation using chained equations to address missing data on urban/rural, region, annual net household’s income per capita quartiles, and maternal age, weight, height and smoke behaviour. The percentages of missing values for these variables were 2.8%, 4.8%, 6.7%, 11.8%, 15.9%, 22.2% and 16.6%, respectively. Given that the CFPS sampling uses implicit stratification and it oversamples five provinces, we used the “mi svyset” command in STATA to adjust the survey design, and performed statistical analyses using the cross-sectional weights for each wave to ensure that our results are nationally representative.20
Analyses were conducted using Stata 18 (Statacorp, TX, USA).
In the study population of 1,629,679 infants from England, the proportions of LBW and macrosomia were 6.0% and 8.5%, respectively. The maternal characteristics of infants born with LBW or macrosomia in England are shown in Table 1. Compared with mothers of infants born without LBW, mothers of infants born with LBW were more from youngest (<20) and oldest (≥40) age groups (11.7% vs 8.8%), Asian ethic groups (15.2% vs 8.7%), urban areas (87.4% vs 85.6%), and the most deprived areas (28.0% vs 21.9%), and had a higher proportion of substance misuse or smoking (28.5% vs 21.9%). Compared with mothers of infants born without macrosomia, mothers of infants born with macrosomia were more likely to be from White ethnic groups (82.8% vs 74.1%), rural areas (15.6% vs 13.0%), and the least deprived areas (17.1% vs 15.1%), and had a higher percentage of obesity or overweight (19.4% vs 13.7%).
| Low birthweight (birthweight < 2500 g) | Macrosomia (birthweight > 4000 g) | Total (N %) | |||
|---|---|---|---|---|---|
| No (N %) | Yes (N %) | No (N %) | Yes (N %) | ||
| N | 1531237 (94.0%) | 98442 (6.0%) | 1491296 (91.5%) | 138383 (8.5%) | 1629679 (100.0%) |
| Age group | |||||
| < 20 | 99737 (6.5%) | 8499 (8.6%) | 101478 (6.8%) | 6758 (4.9%) | 108236 (6.6%) |
| 20–25 | 305298 (19.9%) | 21256 (21.6%) | 301369 (20.2%) | 25185 (18.2%) | 326554 (20.0%) |
| 25–30 | 470321 (30.7%) | 27692 (28.1%) | 453993 (30.4%) | 44020 (31.8%) | 498013 (30.6%) |
| 30–35 | 449038 (29.3%) | 25957 (26.4%) | 432023 (29.0%) | 42972 (31.1%) | 474995 (29.1%) |
| 35–40 | 172126 (11.2%) | 11964 (12.2%) | 168104 (11.3%) | 15986 (11.6%) | 184090 (11.3%) |
| > 40 | 34717 (2.3%) | 3074 (3.1%) | 34329 (2.3%) | 3462 (2.5%) | 37791 (2.3%) |
| Ethnicity | |||||
| White | 1152477 (75.3%) | 66972 (68.0%) | 1104930 (74.1%) | 114519 (82.8%) | 1219449 (74.8%) |
| Black | 51400 (3.4%) | 4880 (5.0%) | 53134 (3.6%) | 3146 (2.3%) | 56280 (3.5%) |
| Asian | 133193 (8.7%) | 14930 (15.2%) | 143657 (9.6%) | 4466 (3.2%) | 148123 (9.1%) |
| Mixed | 26691 (1.7%) | 1963 (2.0%) | 26779 (1.8%) | 1875 (1.4%) | 28654 (1.8%) |
| Other including Chinese | 68443 (4.5%) | 4279 (4.3%) | 68090 (4.6%) | 4632 (3.3%) | 72722 (4.5%) |
| Missing | 99033 (6.5%) | 5418 (5.5%) | 94706 (6.4%) | 9745 (7.0%) | 104451 (6.4%) |
| Substance Misuse or Smoking | |||||
| No | 1194586 (78.1%) | 70397 (71.5%) | 1155389 (77.5%) | 109594 (79.9%) | 1264983 (77.7%) |
| Yes | 335357 (21.9%) | 28045 (28.5%) | 335907 (22.5%) | 27495 (20.1%) | 363402 (22.3%) |
| Obesity/Overweight | |||||
| No | 1223516 (85.8%) | 78863 (86.0%) | 1200436 (86.3%) | 101943 (80.6%) | 1302379 (85.8%) |
| Yes | 202668 (14.2%) | 12845 (14.0%) | 190939 (13.7%) | 24574 (19.4%) | 215513 (14.2%) |
| Urban | |||||
| Yes | 1310012 (85.6%) | 86050 (87.4%) | 1281827 (86.0%) | 114235 (82.5%) | 1396062 (85.7%) |
| No | 204219 (13.3%) | 10949 (11.1%) | 193538 (13.0%) | 21630 (15.6%) | 215168 (13.2%) |
| Missing | 17006 (1.1%) | 1443 (1.5%) | 15931 (1.1%) | 2518 (1.8%) | 18449 (1.1%) |
| Region | |||||
| North | 410207 (26.8%) | 26961 (27.4%) | 399337 (26.8%) | 37831 (27.3%) | 437168 (26.8%) |
| Midlands | 256275 (16.7%) | 18202 (18.5%) | 252456 (16.9%) | 22021 (15.9%) | 274477 (16.8%) |
| South | 560796 (36.6%) | 32756 (33.3%) | 538797 (36.1%) | 54755 (39.6%) | 593552 (36.4%) |
| London | 260586 (17.0%) | 17551 (17.8%) | 259400 (17.4%) | 18737 (13.5%) | 278137 (17.1%) |
| Missing | 43373 (2.8%) | 2972 (3.0%) | 41306 (2.8%) | 5039 (3.6%) | 46345 (2.8%) |
| Neighbourhood income # | |||||
| Q1 (Most deprived 20%) | 335935 (21.9%) | 27608 (28.0%) | 337859 (22.7%) | 25684 (18.6%) | 363543 (22.3%) |
| Q2 (More deprived 20–40%) | 343403 (22.4%) | 23212 (23.6%) | 337096 (22.6%) | 29519 (21.3%) | 366615 (22.5%) |
| Q3 (Less deprived 40–60%) | 320353 (20.9%) | 19260 (19.6%) | 310058 (20.8%) | 29555 (21.4%) | 339613 (20.8%) |
| Q4 (Less deprived 60–80%) | 277781 (18.1%) | 14974 (15.2%) | 265266 (17.8%) | 27489 (19.9%) | 292755 (18.0%) |
| Q5 (Least deprived 80–100%) | 236759 (15.5%) | 11945 (12.1%) | 225086 (15.1%) | 23618 (17.1%) | 248704 (15.3%) |
| Missing | 17006 (1.1%) | 1443 (1.5%) | 15931 (1.1%) | 2518 (1.8%) | 18449 (1.1%) |
The characteristics of infants born with LBW or macrosomia in China are shown in Table 2. Of the final study population of 5,164 infants, the unweighted proportion of LBW and macrosomia was 4.4% and 4.8%, respectively. Compared with infants born without LBW, infants born with LBW were more often female (52.6% vs 46.8%), more from often rural areas (63.2% vs 50.8%) and the Western region (43.0% vs 27.5%), and had a higher proportion of the lowest per capita household income group (32.5% vs 22.3%). Compared with infants born without macrosomia, infants born with macrosomia were more often male (63.6%% vs 52.4%), more frequently from Han ethnic group (91.9% vs 88.4%), urban areas (48.6% vs 45.6%) and the Eastern region (44.5% vs 40.5%), and had a higher proportion of the highest per capita household income group (22.3% vs 17.2%).
| Low birthweight (birthweight<2500 g) | Macrosomia (birthweight>4000 g) | Total (N %) | |||
|---|---|---|---|---|---|
| No (N %) | Yes (N %) | No (N %) | Yes (N %) | ||
| N | 4936 (95.6%) | 228 (4.4%) | 4917 (95.2%) | 247 (4.8%) | 5164 (100.0%) |
| Sex | |||||
| Female | 2311 (46.8%) | 120 (52.6%) | 2341 (47.6%) | 90 (36.4%) | 2431 (47.1%) |
| Male | 2625 (53.2%) | 108 (47.4%) | 2576 (52.4%) | 157 (63.6%) | 2733 (52.9%) |
| Ethnicity | |||||
| Han | 4399 (89.1%) | 175 (76.8%) | 4347 (88.4%) | 227 (91.9%) | 4574 (88.6%) |
| Other# | 537 (10.9%) | 53 (23.2%) | 570 (11.6%) | 20 (8.1%) | 590 (11.4%) |
| Urban/rural | |||||
| Rural | 2509 (50.8%) | 144 (63.2%) | 2534 (51.5%) | 119 (48.2%) | 2653 (51.4%) |
| Urban | 2286 (46.3%) | 78 (34.2%) | 2244 (45.6%) | 120 (48.6%) | 2364 (45.8%) |
| Missing | 141 (2.9%) | 6 (2.6%) | 139 (2.8%) | 8 (3.2%) | 147 (2.8%) |
| Region | |||||
| Eastern | 2032 (41.2%) | 86 (37.7%) | 2008 (40.8%) | 110 (44.5%) | 2118 (41.0%) |
| Central | 1305 (26.4%) | 37 (16.2%) | 1257 (25.6%) | 85 (34.4%) | 1342 (26.0%) |
| Western | 1356 (27.5%) | 98 (43.0%) | 1409 (28.7%) | 45 (18.2%) | 1454 (28.2%) |
| Missing | 243 (4.9%) | 7 (3.1%) | 243 (4.9%) | 7 (2.8%) | 250 (4.8%) |
| Household income per capita | |||||
| Q1 (Lowest 25%) | 1100 (22.3%) | 74 (32.5%) | 1116 (22.7%) | 58 (23.5%) | 1174 (22.7%) |
| Q2 (25%–50%) | 1308 (26.5%) | 65 (28.5%) | 1317 (26.8%) | 56 (22.7%) | 1373 (26.6%) |
| Q3 (50%–75%) | 1322 (26.8%) | 49 (21.5%) | 1316 (26.8%) | 55 (22.3%) | 1371 (26.5%) |
| Q4 (Highest 25%) | 870 (17.6%) | 29 (12.7%) | 844 (17.2%) | 55 (22.3%) | 899 (17.4%) |
| Missing | 336 (6.8%) | 11 (4.8%) | 324 (6.6%) | 23 (9.3%) | 347 (6.7%) |
| Maternal factors | |||||
| Age group | |||||
| < 20 | 85 (1.7%) | 9 (3.9%) | 92 (1.9%) | 2 (0.8%) | 94 (1.8%) |
| 20–25 | 1136 (23.0%) | 59 (25.9%) | 1149 (23.4%) | 46 (18.6%) | 1195 (23.1%) |
| 25–30 | 1767 (35.8%) | 57 (25.0%) | 1735 (35.3%) | 89 (36.0%) | 1824 (35.3%) |
| 30–35 | 918 (18.6%) | 39 (17.1%) | 912 (18.5%) | 45 (18.2%) | 957 (18.5%) |
| 35–40 | 354 (7.2%) | 23 (10.1%) | 346 (7.0%) | 31 (12.6%) | 377 (7.3%) |
| ≥40 | 97 (2.0%) | 9 (3.9%) | 99 (2.0%) | 7 (2.8%) | 106 (2.1%) |
| Missing | 579(11.7%) | 32 (14.0) | 584 (11.9%) | 27 (10.9%) | 611 (11.8%) |
| Smoking | |||||
| No | 4082 (82.7%) | 184 (80.7%) | 4059 (82.6%) | 207 (83.8%) | 4266 (82.6%) |
| Yes | 38 (0.8%) | 2 (0.9%) | 37 (0.8%) | 3 (1.2%) | 40 (0.8%) |
| Missing | 816(16.5%) | 42 (18.4%) | 821 (16.7%) | 37 (15.0%) | 858 (16.6%) |
| Obesity/Overweight | |||||
| No | 2924 (59.2%) | 134 (58.8%) | 2948 (60.0%) | 110 (44.5%) | 3058 (59.2%) |
| Yes | 896 (18.2%) | 35 (15.4%) | 848 (17.2%) | 83 (33.6%) | 931 (18.0%) |
| Missing | 1116(22.6%) | 59 (25.9%) | 1121 (22.8%) | 54 (21.9%) | 1175 (22.8%) |
The proportion of LBW was higher in urban areas (6.2%) than in rural areas (5.1%) in England, but in China the weighted proportion of LBW was lower in urban areas (2.3%) than in rural areas (5.1%). The proportions of LBW were lower in the South (5.5%) of England than in London (6.3%), the Midlands (6.6%) and the North (6.2%), and in China they were lower in the Central region (2.3%) than in the Eastern (3.2%) and Western (6.1%) regions, but the differences were not significant. In England, the most deprived areas had a higher proportion of low birthweight (7.6%) than the other quintiles. In China, the lowest per capita household income group had a higher proportion of low birthweight (5.7%) than the other quartile groups, but the differences were not statistically significant. ( Table 3).
| England (N = 1629679) | China# (N = 5164) | ||||
|---|---|---|---|---|---|
| Low birthweight (% (95%CI)) | Macrosomia (% (95%CI)) | Low birthweight (% (95%CI)) | Macrosomia (% (95%CI)) | ||
| All | 6.0(6.0–6.1) | 8.5 (8.5–8.5) | All | 3.7(2.5–4.8) | 4.9(3.9–5.9) |
| Urban/rural | Urban/rural | ||||
| Urban | 6.2(6.1–6.2) | 8.2(8.1–8.2) | Urban | 2.3(1.5–3.1) | 5.3(4.0–6.5) |
| Rural | 5.1(5.0–5.2) | 10.5(9.9–10.2) | Rural | 5.1(3.0–7.3) | 4.5(3.2–5.8) |
| Region | Region | ||||
| North | 6.2(6.1–6.2) | 8.7(8.6–8.7) | Eastern | 3.2(2.0–4.3) | 5.5(4.0–7.0) |
| Midlands | 6.6(6.5–6.7) | 8.0(7.9–8.1) | Central | 2.3(1.2–3.4) | 5.6(3.9–7.3) |
| London | 6.3(6.2–6.4) | 6.7(6.6–6.8) | Western | 6.1(2.7–9.5) | 3.0(1.4–4.6) |
| South | 5.5(5.4–5.6) | 9.2(9.2–9.3) | _ | _ | _ |
| Neighborhood income | Household income per capita | ||||
| Q1 (Most deprived 20%) | 7.6(7.5–7.7) | 7.0(6.9–7.1) | Q1 (Lowest 25%) | 5.7(3.2–8.3) | 4.9(3.1–6.7) |
| Q2 | 6.3(6.3–6.4) | 8.1(8.0–8.2) | Q2 | 3.4(1.8–5.1) | 4.9(2.9–6.9) |
| Q3 | 5.6(5.6–5.7) | 8.8(8.7–8.9) | Q3 | 2.4(1.3–3.6) | 4.6(2.7–6.4) |
| Q4 | 5.1(5.1–5.2) | 9.4(9.3–9.5) | Q4 (Highest 25%) | 3.1(1.3–4.8) | 5.4(3.1–7.7) |
| Q5 (Least deprived 20%) | 4.8(4.7–4.9) | 9.5(9.4–9.6) | _ | _ | _ |
The proportion of babies with macrosomia was lower in urban areas (8.2%) than in rural areas (10.5%) in England, but in China the difference in the proportions of macrosomia between urban (5.3%, 95% CI 4.0–6.5) and rural areas (4.5%, 95% CI 3.2–5.8) was less and not significantly different. The proportion of babies with macrosomia was higher in the South (9.2%) of England than in London (6.7%), the Midlands (8.0%) and the North (8.7%), and in China was higher in the Eastern (5.5%) and Central (5.6%) regions than the Western region (3.0%), but the differences were not significant. In England, there appeared to be a dose-response relationship between neighborhood income and macrosomia, with 7.0% (95% CI 6.9–7.1) of infants born macrosomic in the most deprived quintile and 9.5% (95% CI 9.4–9.6) in the least deprived quintile. In China, there was no dose-response relationship between per capita household income and macrosomia. ( Table 3).
The RRs and their 95% CIs of LBW across geographical and socioeconomic groups are shown in Table 4 and Figure 1. In England, the univariable analysis showed that living in rural areas was associated with a 17% lower risk of LBW compared to living in urban areas. However, after adjusting for maternal age, ethnicity, smoking, and obesity/overweight the risk lowered (Model one) and the association was no longer significant after further adjustment for neighborhood income (Model two) and region (Model three). In China, the unadjusted RR of low birthweight was 2.23 (95% CI 1.29–3.87) in rural area compared to urban areas; 2.06 (95% CI 1.30–3.25) after adjusting for child’s sex and ethnicity, and maternal age, smoking, and obesity/overweight (Model one); 1.94 (95% CI 1.22–3.07) after further adjusting for per capita household income (Model two); and 1.94 (1.21–3.11) after fully adjustment (Model three). In England, compared to the South region, the unadjusted RR of low birthweight in London was 1.14 (95% CI 1.12–1.16) and in the Midlands was 1.20 (95%CI 1.18–1.22). However, after adjusting for maternal age, ethnicity, smoking, obesity/overweight, urban/rural, and neighborhood income, the RRs changed to 0.90 (0.88–0.92) for London and 0.92 (0.90–0.93) for the Midlands. The unadjusted RR of LBW was 1.58 (95% CI 1.55–1.62) in the most deprived areas compared to the least deprived areas, and the adjusted RR was 1.35 (95% CI 1.32–1.38) after adjusting for maternal age, ethnicity, smoking, obesity/overweight and 1.34 (95% CI 1.31–1.38) after further adjusting for urban/rural and region.
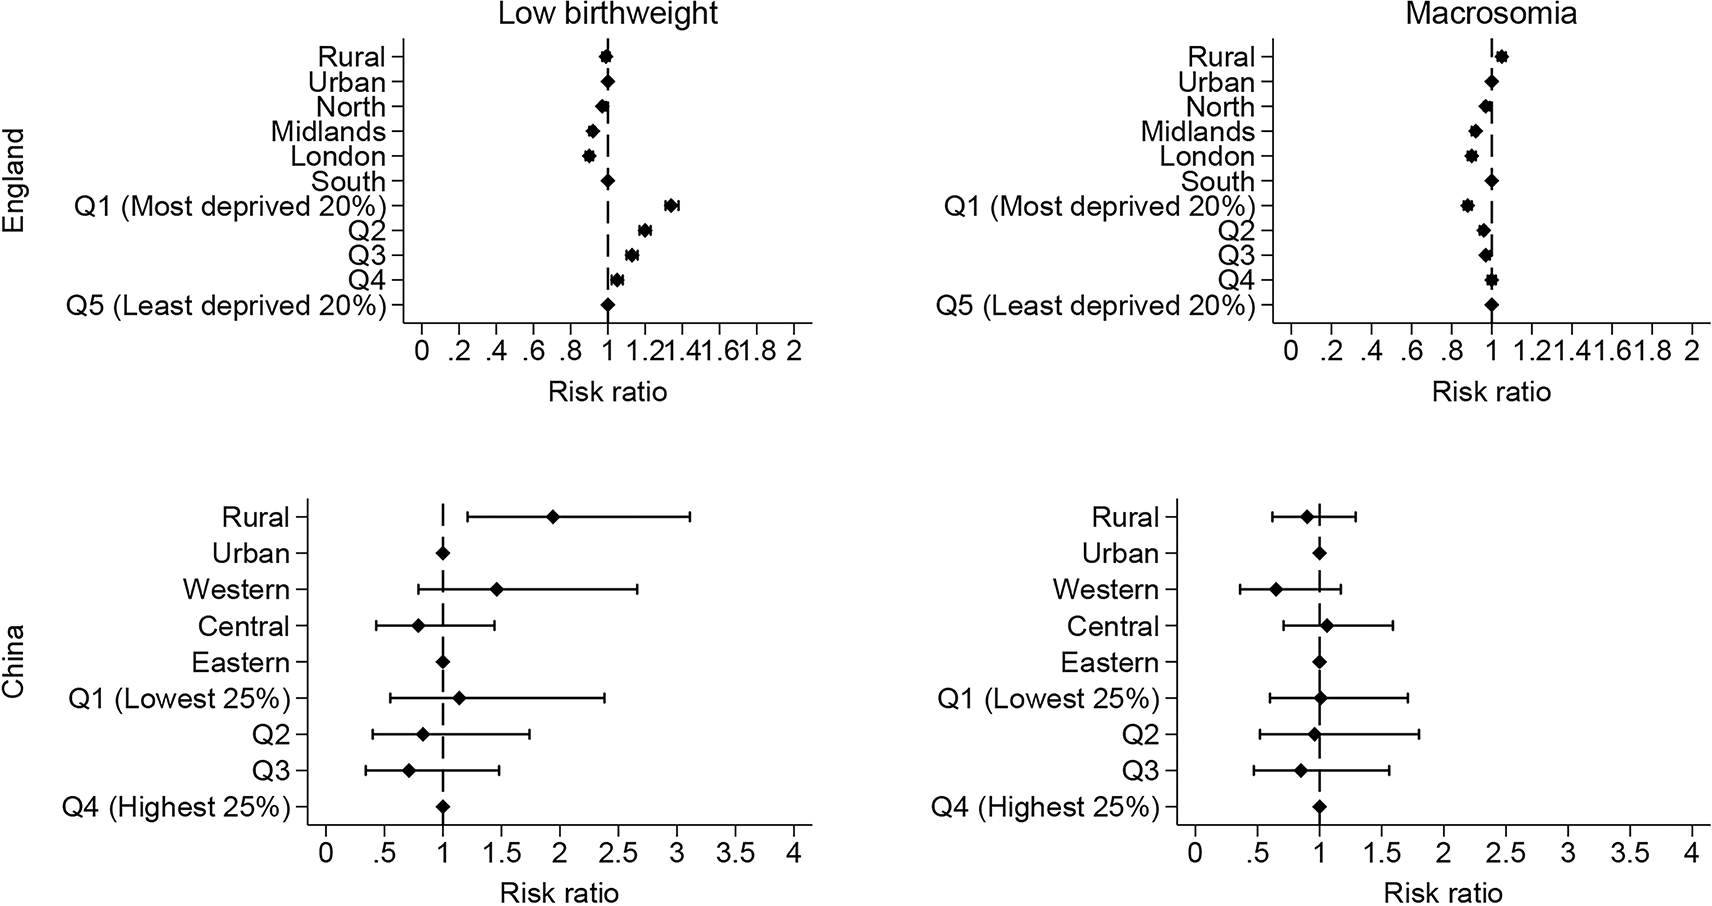
The RRs and their 95% CIs of macrosomia across geographical and socioeconomic groups are shown in Table 5 and figure 1. In England, the univariable analysis showed that living in rural areas was associated with a 23% higher risk of macrosomia compared to living in urban areas, but multivariable analyses showed that the inequality narrowed to 5% in fully adjusted Model 3. Living in London was associated with 27% lower risk of macrosomia compared with living in south of England, and the inequality narrowed to 10% in the fully adjusted model (Model 3). The risk of macrosomia was 26% lower in the most deprived areas compared to the least deprived areas in the univariable model, 14% lower in model 1 and 12% lower in model 3. In China, there was insufficient evidence for an association between rural/urban, region and per capita household income and macrosomia.
Using this cohort of 1,629,679 infants in England from the HES APC dataset from 2013 to 2023 we found geography and socioeconomic status to be associated with both LBW and macrosomia. However, using this cohort of 5,164 infants in China using the CFPS data from 2010 to 2022, we found only significant associations between living in a rural area and LBW.
Patterns of urban-rural inequality in LBW thus appeared to differ between the England and China. In England, the risk of LBW was 17% lower in rural than in urban areas. However, the association was no longer significant after accounting for maternal characteristics, region and neighborhood income. Contrastingly, in China, the risk of LBW was more than twice as high in rural areas as in urban area, and even after accounting for infants’ and maternal characteristics, region and household income, the RR still remained close to two. These different patterns of urban-rural inequality in LBW suggest that universal access to high-quality healthcare in rural areas in England, compared to China, may play a role in urban-rural disparities. In England, there is a higher proportion of ‘outstanding’ general practices (GPs) in rural areas compared to a higher proportion of ‘inadequate’ and ‘requires improvement’ GPs in urban areas.22 In China, while the gap in antenatal care coverage between urban and rural areas has decreased, the quality of care has become a key focus area.23 A study from China found that pregnant women who did not receive regulated and high-qualify antenatal care had a higher risk of LBW.24 Furthermore, the rural areas of Western China continue to have low antenatal care coverage, accessibility, and treatment quality.25
In England, infants of socioeconomically disadvantaged mothers had a 34% higher risk of LBW compared to those from the least disadvantaged mothers, after adjusting for potential confounders. This finding has also been identified in previous studies in England26 and the US,27,28 which also found a negative association between neighborhood-level disadvantage and LBW. Contrastingly, in China, there was no evidence for an association between socioeconomic status and LBW. However, this result might be due to limited study power stemming from the small size of the study population, as other studies from Shaanxi province (Northwest China)29 and Guangdong province (Southern China)30 have found that lower family socioeconomic status was associated with a higher risk of LBW.
Even after adjusting for maternal age, ethnicity, smoking, obesity, and urban/rural residence, there are persistent geographical and neighbourhood socioeconomic disadvantage-related inequalities in macrosomia in England, with the highest risk of macrosomia in the South of England, and in the least deprived communities. Our results showed that the South of England had the highest proportion of macrosomia, while London had the lowest, which is consistent with other reports.31 It suggests the influence of unmeasured regional factors that may include variations in maternal care access,12 dietary pattern,32,33 and health behaviour shaped by local environments.27 Our result shows that women living in the most income deprived areas had a lower risk of macrosomia than those living in the least deprived group, which is consistent with a previous study in West Midlands of England.34 Contrastingly, the geographical and socioeconomic inequalities in macrosomia in China were not statistically significant which again may be explained by the lack of statistical power to detect an association due to the small sample size. Previous studies in Southern and Northwest China found that higher socioeconomic status was associated with a higher risk of macrosomia.29,30 Moreover, significant associations were found between urban and rural areas and LBW but not for macrosomia in China. This may indicate that in China, the urban-rural disparity in LBW is greater than that in macrosomia, suggesting that interventions targeting LBW should be prioritised in rural areas of China.
This study adds to the literature of cross-country analysis of patterns of inequality in adverse birth outcomes. However, this study has several limitations. The HES APC dataset is an administrative hospital database that lacks key variables such as detailed information on individual socioeconomic factors. Furthermore, the maternity data on every birth record is optional and not mandated for collection, which leads to large variations in data quality and completeness between hospitals. The CFPS of China is a household survey database, and infants’ information was reported by their parents or other primary caregivers, which may affect data accuracy due to recall or reporting bias. The sample size of the study population from CFPS was small, which limits its statistical power. Moreover, maternal age, weight, height, and smoking (yes or no) were measured at the time of CFPS survey (within two years after childbirth). We assume that these measurements reflect pre-pregnancy or antenatal conditions. However, as maternal health behaviours and physiological characteristics may change between the antenatal and postnatal periods, this assumption may introduce potential classification errors or measurement bias. Last but not least, the HES APC data is population-based whereas the CFPS is not. Furthermore, socioeconomic factors were measured at the neighborhood level with quintiles in the HES APC dataset, but at the household level with quartiles in the CFPS dataset, making it impossible to directly compare the magnitude of inequality between the two countries.
Patterns of geographical and socioeconomic inequality in LBW and macrosomia appeared to differ between England and China. We found that in England, geographical region and socioeconomic status were associated with LBW and macrosomia; whereas in China, there was an association between living in a rural area and LBW. This suggests the importance of considering these different patterns and the underlying structural causes when determining how to improve perinatal outcomes in different countries. Interventions focused on individual-level risk factors are essential but insufficient by itself to tackle disparities in abnormal birthweight. Further research is required to identify the underlying structural causes of inequalities in abnormal birthweight. This will aid in creating and implementing policies and public health initiatives that target structural geographical and socioeconomic disadvantages to improve perinatal outcomes in different countries.
Under the assessment of the NHS Health Research Authority, using the HES APC data to conduct epidemiological and health service research at the University of Oxford does not need research ethics committee approval as it is anonymised data. For CFPS, ethical reviews were submitted periodically to the Biomedical Ethics Review Committee of Peking University, and data collections were carried out only upon receiving review approval (approval number IRB00001052–14010). This study was conducted in accordance with the principles of the Declaration of Helsinki.
Provide sufficient details of any financial or non-financial competing interests to enable users to assess whether your comments might lead a reasonable person to question your impartiality. Consider the following examples, but note that this is not an exhaustive list:
Sign up for content alerts and receive a weekly or monthly email with all newly published articles
Register with NIHR Open Research
Already registered? Sign in
If you are a previous or current NIHR award holder, sign up for information about developments, publishing and publications from NIHR Open Research.
We'll keep you updated on any major new updates to NIHR Open Research
The email address should be the one you originally registered with F1000.
You registered with F1000 via Google, so we cannot reset your password.
To sign in, please click here.
If you still need help with your Google account password, please click here.
You registered with F1000 via Facebook, so we cannot reset your password.
To sign in, please click here.
If you still need help with your Facebook account password, please click here.
If your email address is registered with us, we will email you instructions to reset your password.
If you think you should have received this email but it has not arrived, please check your spam filters and/or contact for further assistance.

Comments on this article Comments (0)